
AI Knowledge Graphs: The Missing Layer in Modern Analytics
What is a knowledge graph, and how does it give AI the context it needs to answer accurately?
What's the difference between semantic graphs and labeled property graphs?
How do knowledge graphs solve conflicting definitions, hidden relationships, and shifting business logic?
Where do knowledge graphs hit their limits, and what does an Adaptive Context Engine do differently?
PUBLISHED:
UPDATED:
Static dashboards died a slow death a few years ago — every company had them, but no one actually used them to make decisions. Look closely at AI right now, and you’ll see most tools are drifting into the same purgatory. We've got copilots, conversational BI, and agents crowding every roadmap, yet the outputs keep landing somewhere between mediocre and unreliable.
Gartner predicts that by 2029, at least 70% of organizations running agentic AI in production will hit a service, security, or cost incident because the guardrails around runtime aren’t strong enough.
The writing on the wall is clear: AI doesn't understand your business. It doesn't know what your data entities mean, how they connect, or what it can do with them. Without context, every answer is just an elaborate guess.
Is the knowledge graph the solution? That’s what we’ll explore in this article.
What is a knowledge graph?
A knowledge graph is a machine-readable map of how your business is wired together. Instead of trapping data in flat, disconnected tables, it stores information as a living network.
Business entities—like your customers, orders, and engineers—become the nodes. And the connections between them become the edges. Because this structure maps how different entities interact, pointing an LLM at it gives the AI the exact enterprise context it needs to answer complex questions definitively.
You've probably seen knowledge graphs at work already. Google's Knowledge Graph powers the search answers you see every day. LinkedIn uses one to connect people to jobs, skills, and companies.
Core components of knowledge graphs
A knowledge graph is built on a few core elements. To see how they fit together, let's take revenue as an example:
Nodes: The specific entities your business tracks, like a customer, an order, or a sales region.
Edges: The relationships that connect those entities. A customer placed an order, and that order contains a product. Each connection is stored as a concrete fact, so instead of guessing how two data points relate, the LLM just reads the edge.
Properties: The attributes that describe a node or an edge. An order might carry a value and a close date. Without properties, AI only knows that a transaction happened. With them, it knows the order was worth $4,200 and closed in March.
Ontology: The rules that govern the entire system. The ontology dictates which entities can exist and how they are allowed to interact. An order can be placed by a customer, but cannot be managed by one. The LLM inherits those rules, stopping it from hallucinating a relationship that defies your business logic.
If you ask, "Which products drove revenue in the West region?", the model doesn't scan a flat table. It walks the path:
Region → contains → Accounts → placed → Orders → contains → Products
Nothing is pulled from a static report. The model assembles the answer in real time by following the connections you created.
Types of knowledge graphs
Knowledge graphs can be built from structured, semi-structured, and unstructured data sources. What differentiates them is how they store those facts under the hood. Almost every modern graph relies on one of two architectures:
Semantic graphs | Labeled property graphs | |
How facts are stored | Triples: subject, relationship, object | Nodes and edges, each carrying labels and properties |
Schema | Ontology defined upfront | No strict schema required, model as you go |
Biggest strength | Answers you can trace back to a stated rule | Speed of build and speed of traversal |
Common tools | RDF, OWL, SPARQL | Neo4j, TigerGraph |
Let’s take a closer look at how each model operates in practice.
Semantic graph: The rules engine
A semantic graph breaks your data down into triples. Every triple is a single fact with three parts: a subject, a relationship, and an object.
Part | What it is | How to spot it | Example |
Subject | The entity the fact is about | Ask: "Who or what is this statement centered on?" | Patient P-1024 |
Relationship | The verb or connection that links two things | Ask: "How does the subject connect to a thing?" | is prescribed |
Object | The thing the subject is connected to | Ask: "What does the relationship point to?" | Metformin 500mg |
Once the graph has collected those triples, an ontology sits on top of them. That ontology tells the AI what your business terms mean and what it's allowed to conclude from them. It's the layer where your team writes down how the organization's data is classified and how it relates, rather than leaving that knowledge in someone's head. This is what makes reliable text-to-SQL possible — the AI knows what "high-risk" or "active customer" means, instead of guessing.
And because every relationship carries a precise definition, the graph can deduce new facts on its own, without you building a data pipeline to spell them out.
Ideal use case: Regulated industries. When auditing is part of the job, you need answers you can trace back to a definitive, stated rule. That is exactly what the ontology provides. If someone challenges a metric, the graph can show them the exact logical path it took to get there.
Labeled property graphs (LPGs): The agile network
In an LPG, nodes carry labels that define what they are, and edges carry types that tell how they interact. A node labeled Person is a person, and the edge running from it to a company might be typed WORKS_AT.
Nodes can also hold multiple labels simultaneously. If an employee buys your product, the same node is simply labeled both Person and Customer.
Because LPGs do not require you to write a massive ontology upfront, you can model whatever data you have right now and change it later. This flexibility is why most data and engineering teams naturally gravitate toward this architecture.
Ideal use case: High-speed pattern recognition. If you need to move fast, this is your graph. LPGs work well with use cases such as fraud detection, supply chain management, and cybersecurity, where the primary goal is traversing the network instantly to discover hidden connections.
How do knowledge graphs help in building reliable AI analytics?
AI analytics have no shortage of data to pull from or intelligence to infer with. What it lacks is accuracy.
Think about what happens when you ship an AI analyst. Adoption skyrockets. Everyone starts asking questions directly, and nobody is waiting three days for a dashboard anymore. It's a massive win for your data team.
But suppose just one of those answers rests on the wrong definition of a metric. It doesn't trigger a broken query or an error message. It yields a clean, confident number, and everyone trusts it. By the time anyone catches the mistake, that number has been operating as the company truth for an entire quarter.
That's exactly the risk knowledge graphs are built to eliminate. Here's how:
Resolves conflicting definitions
Every team runs on its own stack, and every stack has its own version of the truth. Sales lives in the CRM, Finance in the ERP, and Marketing in the automation platform. Because context is trapped in these silos, the business rarely agrees on what its data actually means.
Take something as basic as the product catalog. Marketing groups SKUs by campaign, finance groups them by revenue category, and the warehouse stores them by whatever the ingestion pipeline decided three years ago. Ask an AI which product line drove growth, and the model has to pick one of those three groupings, with nothing to tell it which one you meant. So it picks whatever looks plausible and hands you a number.
How a knowledge graph settles ambiguity
With a knowledge graph, you define what a term means once, before anyone asks a question. That definition sits in the ontology, in the layer that the AI reads. And even when two databases have conflicting terminologies for similar concepts, knowledge graphs can harmonize them by treating them as distinct, related classes.
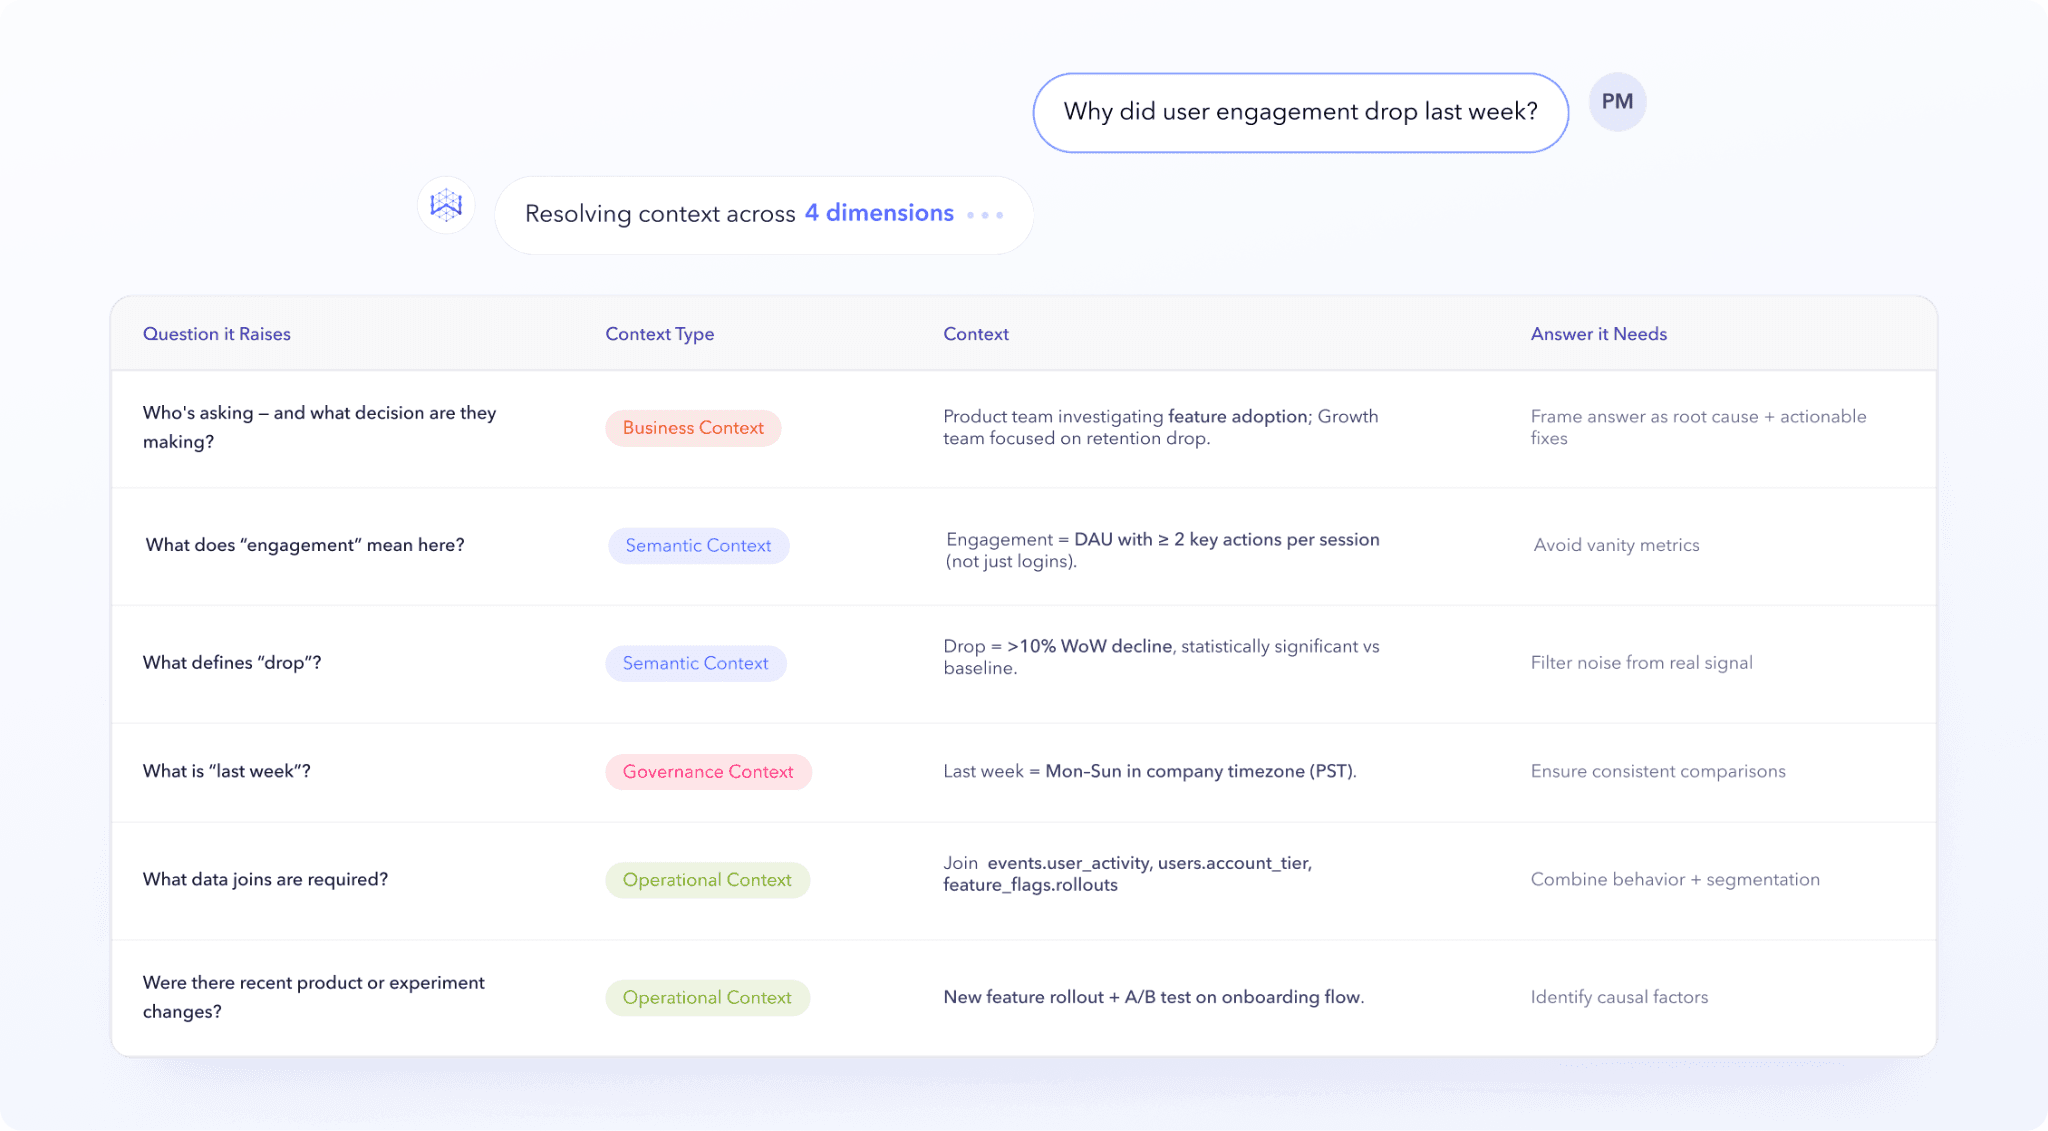
But the graph only holds the definitions you've already resolved. The harder problem is knowing a conflict exists in the first place. Nobody files a ticket when finance and sales quietly drift apart on what counts as revenue. Which is why an Agentic Analytics Platform has to find the drift before it reaches an answer. WisdomAI's Semantic Conflict Resolver flags clashing definitions across sources and routes them for human review before they can corrupt AI outputs.
The result: conflicting definitions get caught and resolved before they reach the model, so the AI answers based on what your business actually agreed on.
Turns a data catalog into a map
Most businesses have a data catalog. It’s an inventory that tells you exactly what tables, columns, and dashboards exist. What it misses, however, is how any of them connect—and those connections are what actually run your business.
Take a customer support ticket. That ticket maps to a product area with a named owner, and carries an SLA based on its severity. A data catalog is blind to this workflow. Instead, those relationships live exclusively in the minds of your analysts, meaning the underlying logic must be rebuilt from scratch for every query.
And that only covers structured data. The contract governing that customer's account is likely locked in a PDF. Because a catalog can't index unstructured text, your AI operates as if that critical context doesn't even exist.
How a knowledge graph resolves cross-entity relationships
A knowledge graph stores relationships as first-class data — not as a custom SQL or a fragile naming convention, but as a governed fact.
Customer filed ticket → Ticket belongs to product area → Product area has a named owner → Owner works to deliver within SLA that the ticket carries.
The AI reads these relationships the exact same way it reads a table name, so it never has to hallucinate how two things connect. And because these paths are explicitly mapped, they run in both directions: If you ask which engineers keep getting escalations from your largest accounts, the model simply walks the path from the account, down to the tickets, and over to the owners.
The same works across formats. That contract PDF becomes a node, connected to the customer account it governs. The graph links them at the concept level, so the AI can follow a path from a revenue number straight to the clause that explains it. Nobody has to flatten the document into a table first.
No massive overhaul when business logic changes
In a traditional BI setup, shifting business logic means rewriting queries, restructuring tables, or waiting for a massive data engineering sprint. If you roll out a new pricing tier before those updates happen, the AI keeps calculating revenue using the old formula, handing out confident, outdated answers until someone catches the mistake.
When that happens, trust erodes fast. Users immediately go back to pulling their own data or waiting in your data team's backlog.
How a knowledge graph absorbs the change
A knowledge graph separates your business logic from where the data is stored and how the model reads it. The definition of an "active user" doesn't live in a fragile SQL query—it lives in the ontology.
When that rule changes, you update it in exactly one place. There is no rewriting a thousand downstream queries or no fine-tuning the data model. The next question the AI receives resolves instantly against the new definition.
But here's the honest tradeoff: The graph makes updates easy, but it relies entirely on your team to trigger them. Once you build a semantic model and it goes stale, you have to keep remodeling it.
The limitations of knowledge graphs
A knowledge graph is a massive architectural upgrade from traditional databases, but it is not a silver bullet. A graph is only as good as the reality it reflects. If you treat it as a "set it and forget it" system, stale and inconsistent data will quickly undermine its utility. Here’s how this architecture hits operational limits:
Rigid ontologies
An ontology is a controlled vocabulary, and most business users don’t know schemas.
When a sales leader asks how many customers they lost last quarter. The graph has churned_account, and nothing that connects those two phrases. Also, when you ask which accounts "went dark," there's no node for that term, even though every rep in the company knows exactly what it means.
Every gap between corporate slang and the formal graph is a place where the AI is forced to guess. You can patch these holes with synonym mappings and aliases, but that just creates another endless layer to maintain while the company's vocabulary keeps moving.
You don't need another manual list; you need an adaptive system that continuously reviews your domain context. For instance, WisdomAI’s Domain Health automatically audits your context to tell you exactly what's missing, what's ambiguous, and what is quietly sending the AI in the wrong direction. By turning those blind spots into a prioritized list of recommendations, you can systematically codify accuracy and reliability into your AI analytics.
Query complexity
Graph queries are fast when they're simple. Ask for an account's open tickets and the engine takes one step, finds the answer, and stops.
The deeper you go, the more expensive it gets, because every hop multiplies the paths the engine has to check. The real bottleneck is a heavy node: your biggest customer, or a broad region like the United States. Any query routing through one of those hubs has to fan out across thousands of connections before it can move forward.
In agentic analytics, this problem compounds. Analytics Agents run a sequence, so a single business prompt might trigger five or ten traversals. And every one of those hops comes back with context that the model has to read. You burn more tokens on one question than a straight database lookup would spend in a week.
The maintenance tax
The true cost of a knowledge graph isn't the initial build; It's that you now codify knowledge every few weeks to keep it from rotting.
The manual bottleneck: Every new schema change, table, and metric must be hunted down and mapped by a human.
Silent failures: Nothing in the system tells you when definitions have started to drift.
False confidence: A stale graph allows AI to hallucinate with absolute certainty, feeding you a three-month-old picture of the business.
Learning gaps: A business is dynamic. Ops might realize churn shows up in support tickets six weeks before renewal, or a rep might introduce a sharper forecasting technique. These on-the-ground organizational learnings never reach the graph, meaning it rarely reflects how your business actually operates today.
So you end up funding a maintenance team indefinitely, with no guarantee the AI is working from anything close to current reality.
Why do you need an Adaptive Context Engine?
AI models aren't going to get better at reasoning over bad data. As we saw in our recent Anthropic case study and in the limitations above, the best AI infrastructure for analytics is one where enterprise context is continuously built, validated, applied, and improved. We call this the Context Development Lifecycle. It treats business logic as a living system rather than a static asset — and the Adaptive Context Engine (ACE) is that lifecycle delivered as a product.
Architecturally, ACE is not a graph database. It's a governed context layer: table descriptions, metric definitions, relationships, and learned business knowledge, much of it extracted automatically from documents and code. That context gets assembled and handed to the AI at the moment of the question, while the query itself runs directly against your warehouse.
That architecture takes on two of the limitations that hold knowledge graphs back:
Rigid ontologies become adaptive: ACE builds context from how people use it.
If you say "went dark" and teach the meaning once, it becomes part of the context without any synonym list to maintain. If you give it a known-correct answer, it works backward to the definition that produces it. The vocabulary sharpens with every interaction instead of decaying.The maintenance tax becomes a health check: Drift detection catches schema, knowledge, and freshness changes the moment upstream sources shift. Domain Health turns those gaps into a prioritized review queue. You approve changes instead of hunting for them.
Beyond fixing the gaps, the same architecture delivers one more advantage:
One context, every surface: Because context lives in one governed layer, the same definitions power conversational BI, text-to-SQL, embedded dashboards, and Analytics Agents. Finance and sales get the exact same number no matter which tool they ask, because the answer resolves against a single source of truth.
See how customers like ConocoPhillips and Cisco achieve 95% AI accuracy on their complex enterprise data. Book a demo today.