
What is Data Analytics? Your Guide to the Agentic AI Era
What does modern data analytics actually look like in the agentic AI era?
What's changing at every layer of the analytics stack right now?
How are enterprises actually using AI analytics today, and what results are they seeing?
What separates the analytics winners of 2026 from everyone else?
PUBLISHED:
UPDATED:
Like everything else touched by AI, data analytics is not what it used to be. What was once a specialist function locked behind analysts, dashboards, and week-long ticketing queues has become a core capability that anyone in the business can now use.
But faster answers do not automatically mean better decisions. Most analytics tools still stop at the surface, telling you what happened, how much, and when. The deeper questions about why it happened and what is truly driving the business get ignored simply because they demand too much time and willingness to dig.
If you want to get past the surface and into the insights that move the business forward, this guide is built for you.
What is data analytics?
Data analytics is a multi-step process that involves collecting data from different systems, cleaning and structuring it, then examining it to find patterns, causes, and opportunities.
The discipline draws from a wide mix of methods, tools, and techniques. Some are decades-old classics like statistics, aggregation, and visualization. Others are newer and still evolving, like agentic reasoning and conversational data querying. Your team can pick and choose from all of them, depending on the question you're actually trying to answer.
Because every business user asks different questions and chases different goals. The best analytics setup is the one that keeps up with your business needs.
The four types of data analytics
Data analytics is usually broken into four types, each answering a progressively harder question:
Question it answers | Example | |
Descriptive analytics | What happened? | Revenue dropped 8% in Q3. |
Diagnostic analytics | Why did it happen? | Revenue dropped because our top enterprise customers switched to a competitor after a pricing change. |
Prescriptive analytics | What's likely to happen next? | If the trend continues, we'll lose another 12% of that segment by Q1. |
Predictive analytics | What should we do about it? | Prioritize a win-back campaign for the affected segment and flag the pricing change for review. |
Let's look at each layer in detail:
Descriptive analytics
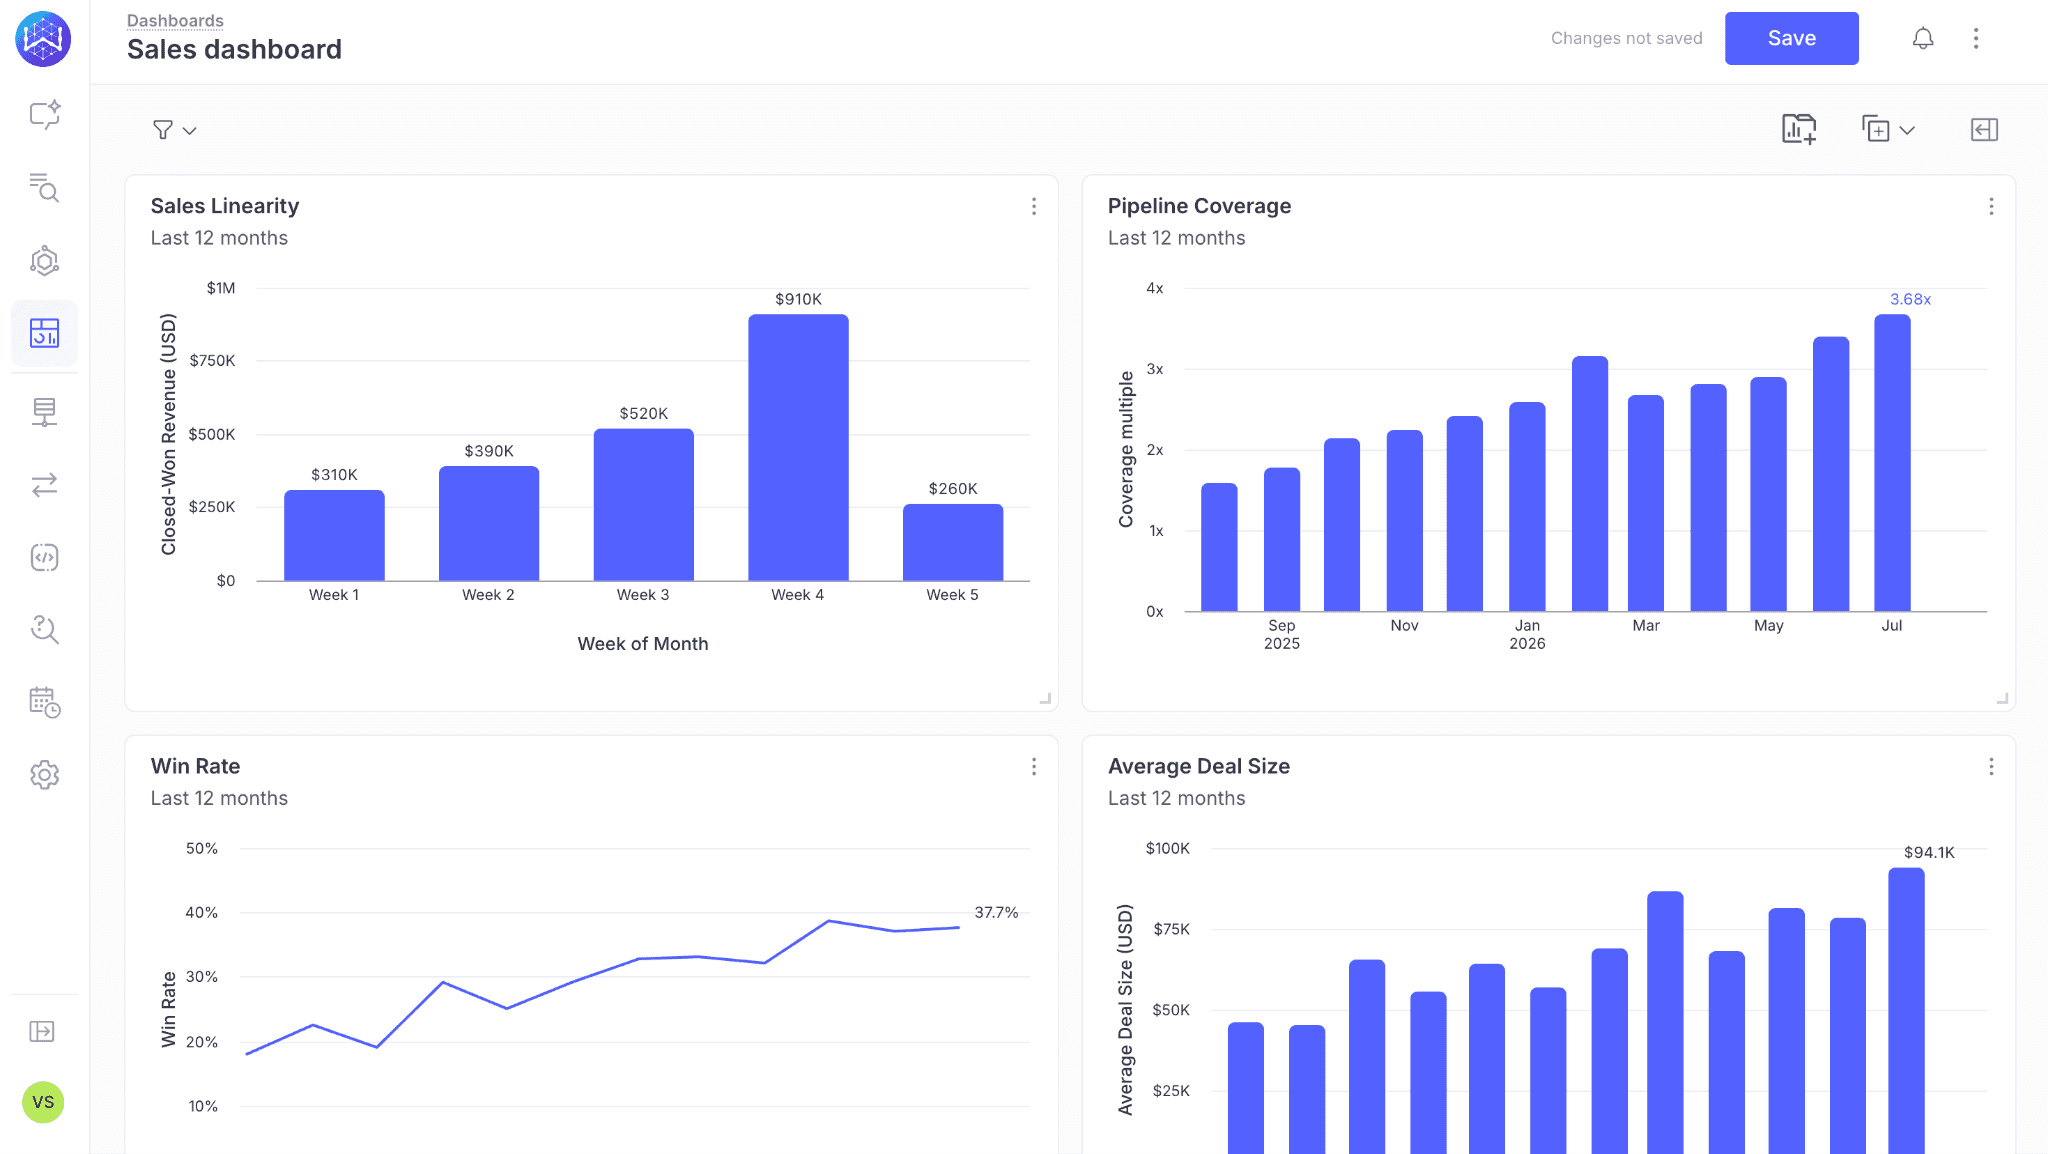
Descriptive analytics summarizes and interprets historical data to reveal what happened in a business. It highlights the events, patterns, and trends that shaped past performance. When a sales leader reviews this month’s performance and notices sales linearity has started slipping, they're using descriptive analytics. It relies on data aggregation and KPI visualizations to power every standard report and monthly review your team runs.
Diagnostic analytics
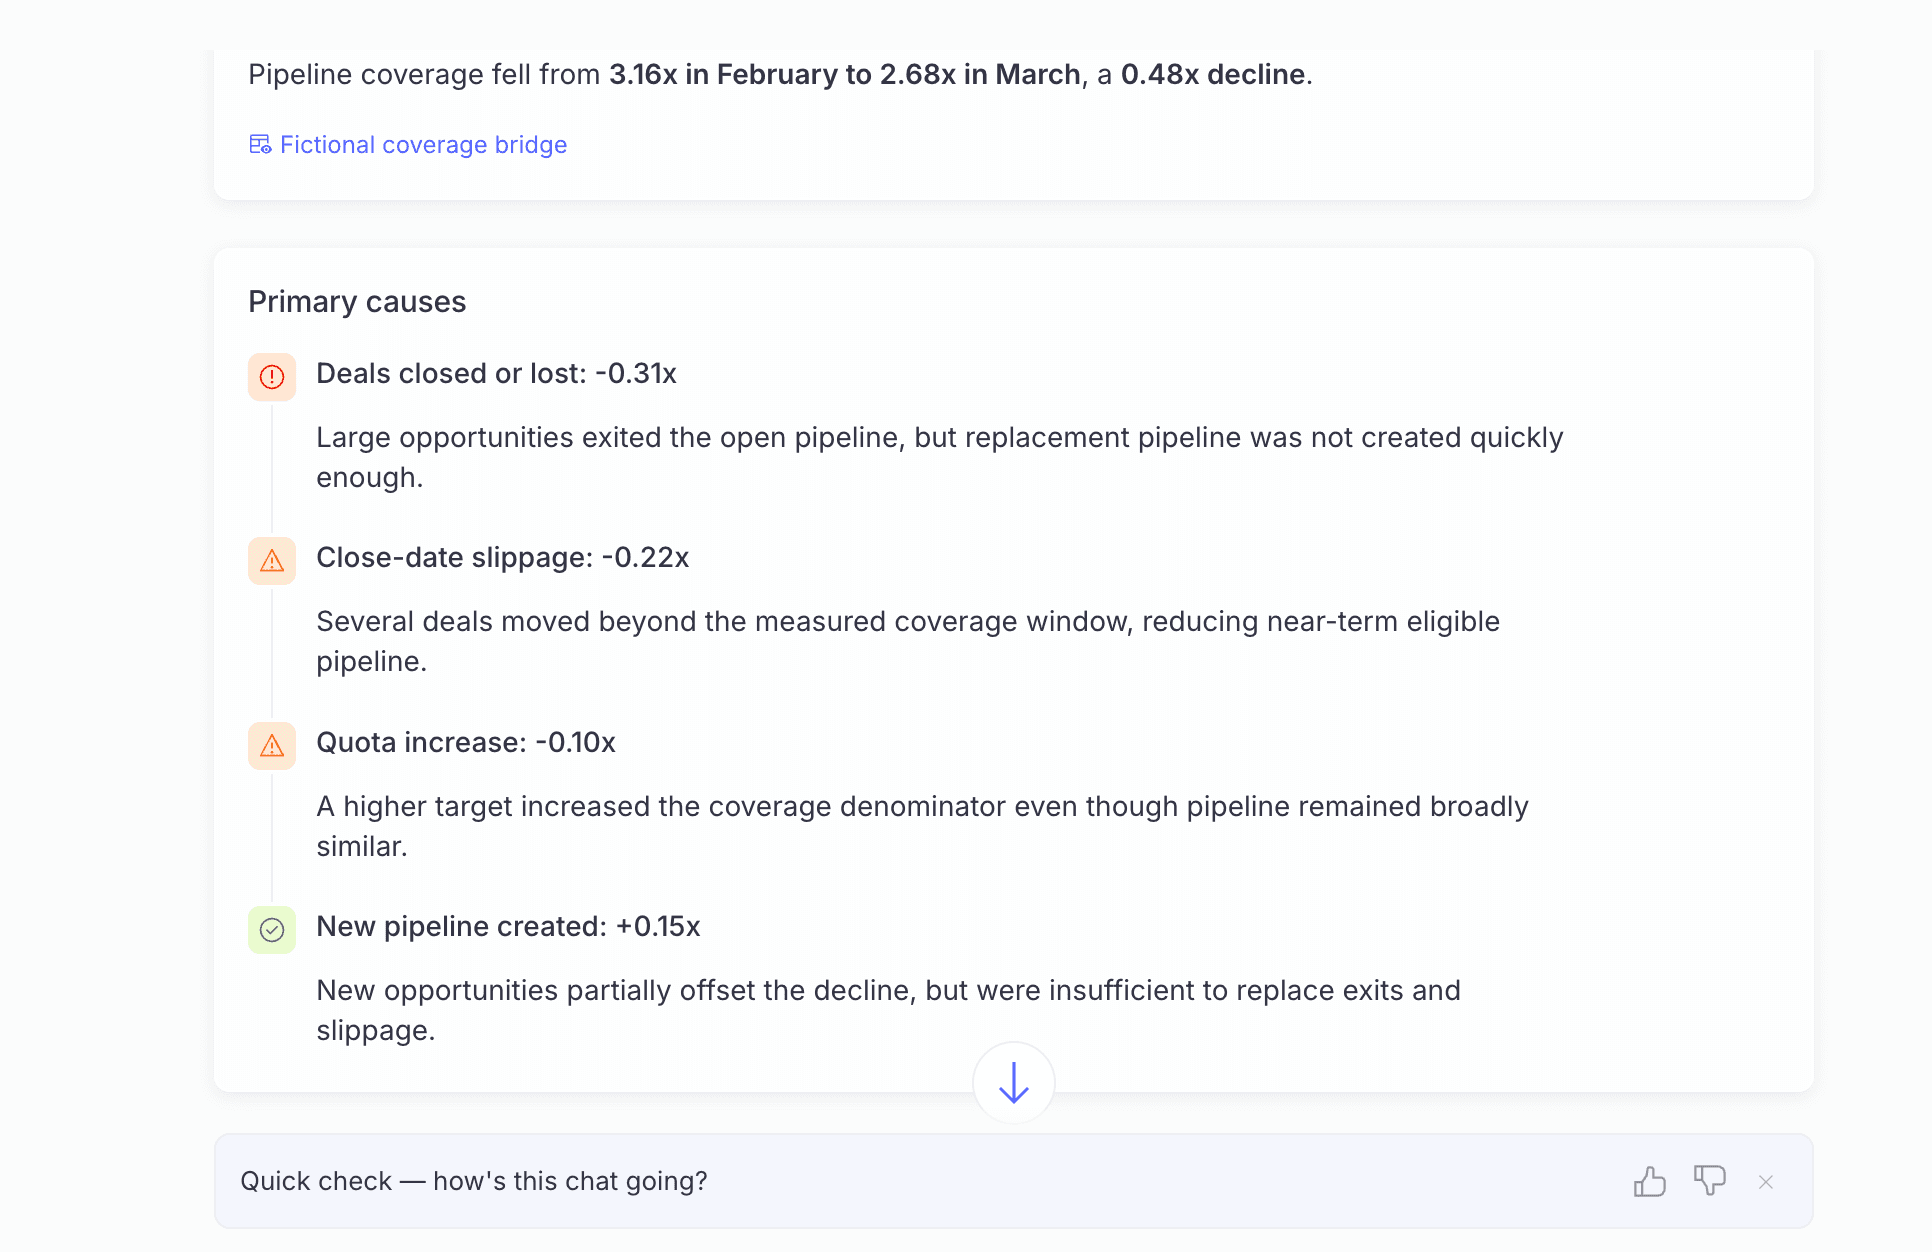
Diagnostic analytics is the analytical layer that answers why. It digs into the causes behind a trend, using techniques like cohort analysis, drill-downs, correlation studies, and root-cause investigations to isolate what's actually driving the numbers. That same sales leader, wanting to understand a drop in pipeline, breaks the metric down period over period to see which factors contributed most to the decline.
Predictive analytics
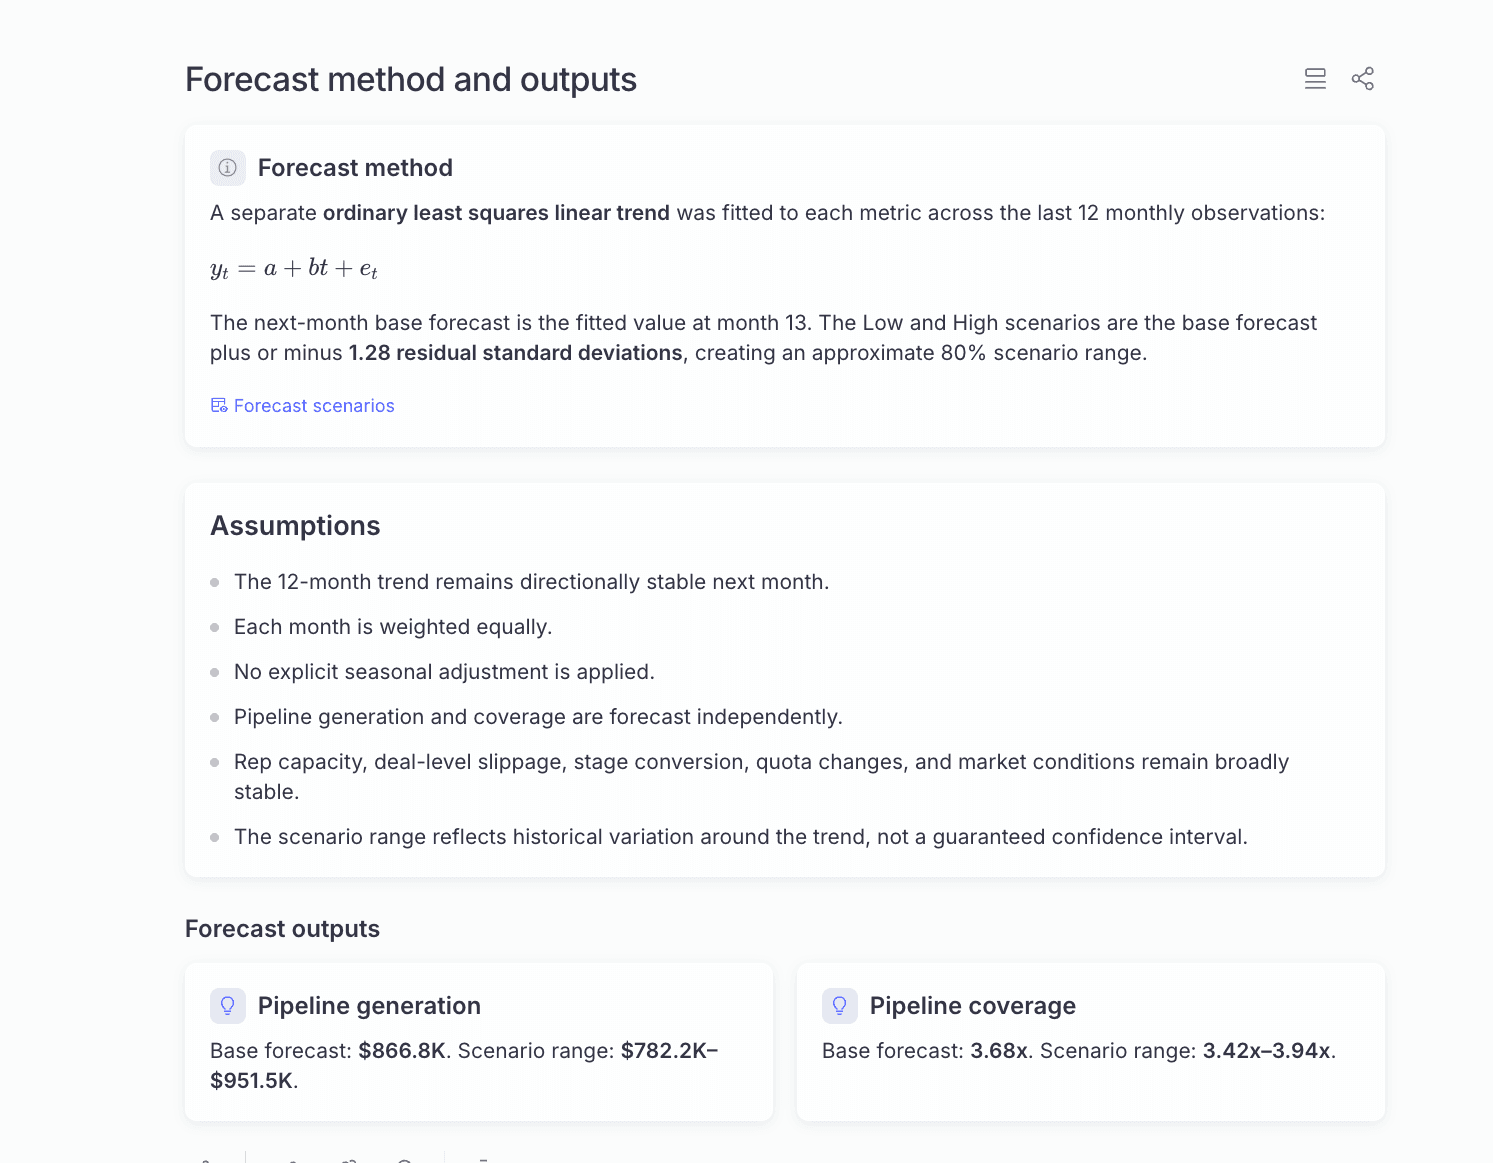
Predictive analytics uses historical patterns to forecast what's coming. Techniques like regression, time-series forecasting, classification, and clustering help you anticipate trends before they play out. Now that the sales leader knows what's driving the slip, they want to know what it means for next quarter. Predictive analytics combines current pipeline velocity, historical close rates, and seasonality patterns to project where bookings are likely to land if the trend holds.
Prescriptive analytics
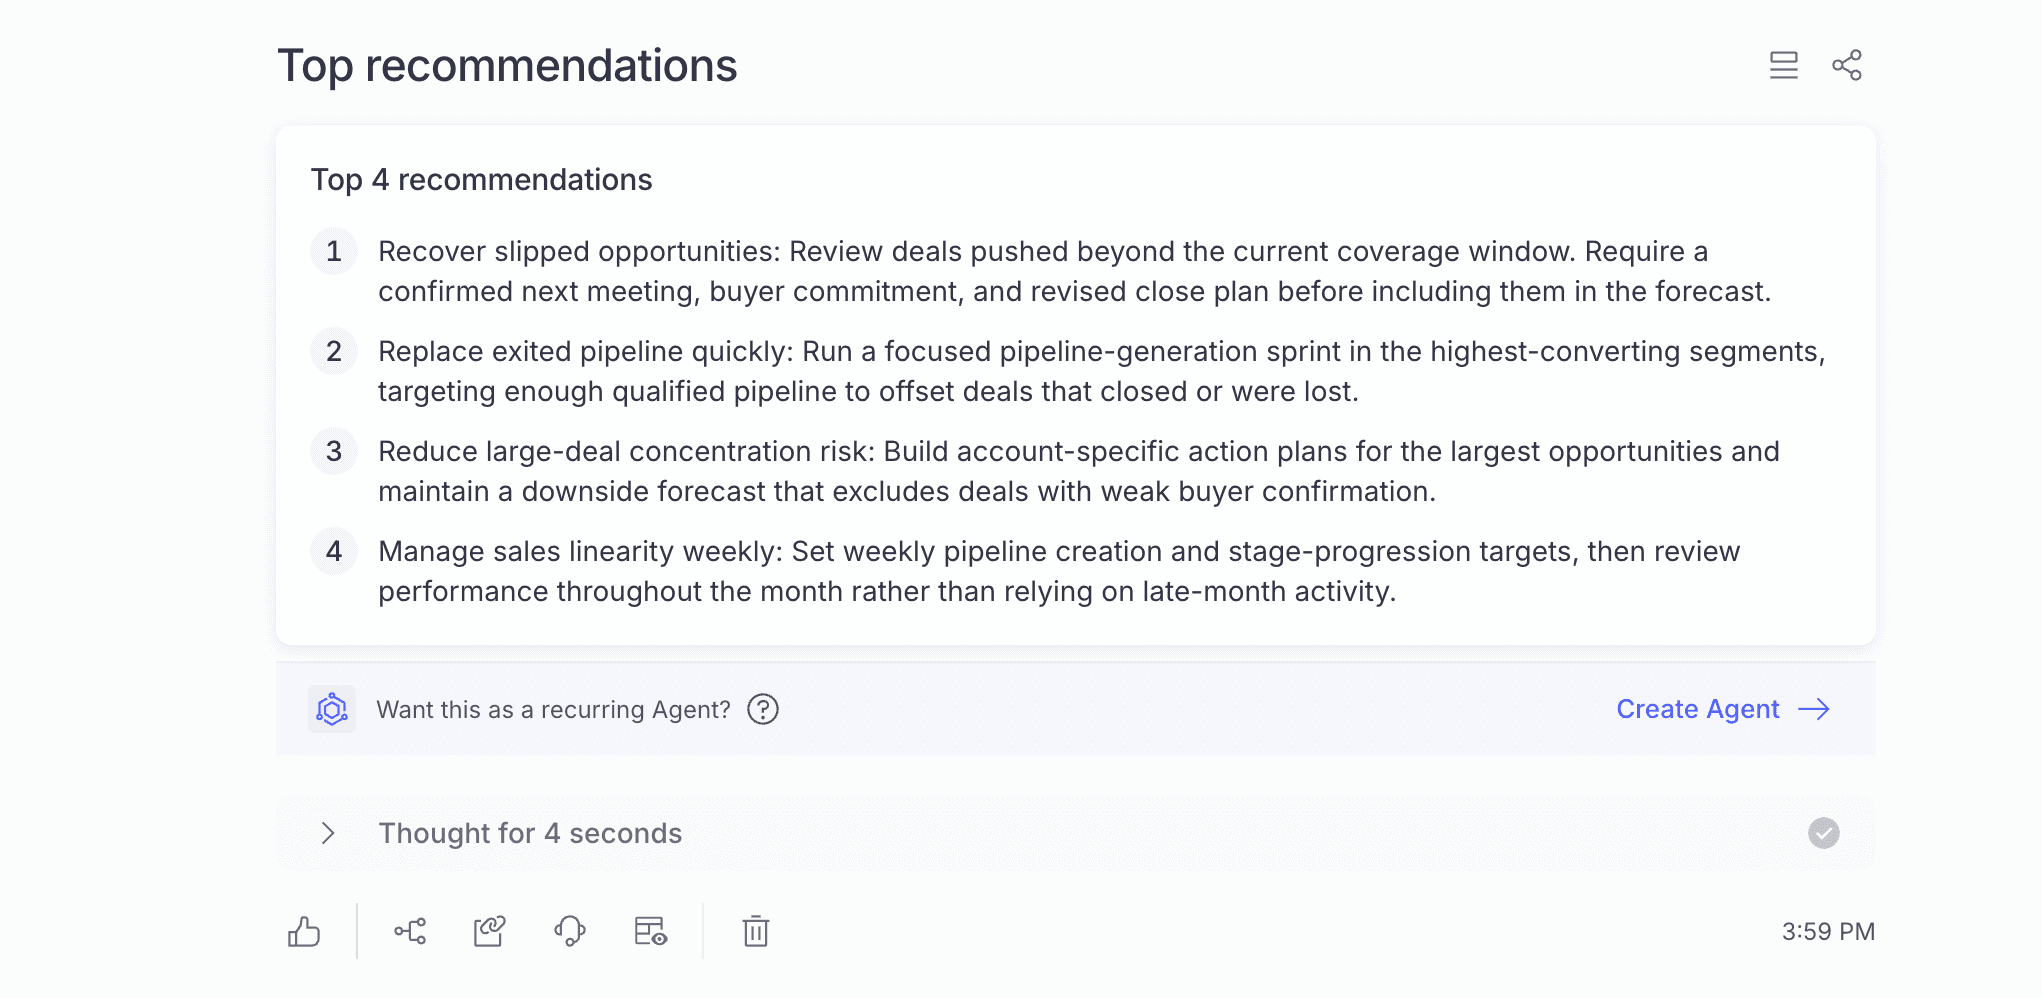
Prescriptive analytics recommends action. It combines optimization models, simulation, and AI systems that reason across trade-offs and constraints in real time to answer what your team should actually do next. Faced with a projected shortfall, the sales leader gets a ranked list of recommendations to prioritize this week, based on churn probability, contract value, and rep capacity.
The core layers powering data analytics
The foundation: data infrastructure
Data infrastructure is the foundation analytics runs on. It's where raw data lives, moves, and gets shaped into something usable. Warehouses like Snowflake and Databricks store the data, ingestion tools pull it from your core systems, and transformation tools shape it into query-ready models.
For years, the strategy was to centralize everything into one warehouse, one semantic layer, and one data pipeline. But reality is messier. Data is fragmented across lakes, warehouses, and spreadsheets, each with its own definitions and governance rules. Analysts have to spend hours reconciling numbers, and every new source turns into a complex migration project. This fragmented tooling has become one of the highest hidden costs for enterprise data teams.
Data federation is the new way forward. Instead of moving your data into one place, federation creates a virtual layer over your existing sources. When a question comes in, it queries the data where it already lives and pulls only what that question needs. The results are immediate: migrations shrink, integrations simplify, and conflicting definitions of core metrics finally live in one queryable domain.
The middle layer: query and analysis
Query and analysis is the layer where questions turn into answers. For analysts and data engineers, SQL has been the workhorse for decades, and it still runs most of the world's analytics. What's shifting is that your team no longer has to write every query from scratch. Modern Text-to-SQL systems, powered by large language models, turn natural-language questions into working SQL drafts in seconds, collapsing hours of writing and debugging into minutes.
Once the query returns results, the analysis begins. Traditionally, this is where analysts took over: exploring distributions, testing hypotheses, running cohort comparisons, and stress-testing findings before anything reached a stakeholder. That's changing fast. Business users can now query, explore, and pressure-test their own data inside the same interface, collapsing what used to be a multi-day analyst hand-off into a live conversation with the data.
The depth layer: statistical and machine learning techniques
For deeper analysis, your team can turn to statistical and machine learning techniques to predict what's likely to happen next and what to do about it.
Data scientists typically run these in Python and R notebooks, applying methods like regression, classification, clustering, and time-series forecasting to model patterns across customers, revenue, and operations. What used to require a full data science team is now becoming embedded inside modern analytics tools thanks to AI. So now, your business users and decision makers can access capabilities like anomaly detection and demand forecasting without ever building or training a model themselves.
The surface: business intelligence and visualization
Business intelligence and visualization is the top layer, where insights become action. It's where query results turn into charts, dashboards, and reports that you and your team can easily read at a glance.
But the way people interact with data is changing fast. With GenAI-powered analytics and Conversational BI, your team can now ask questions in natural language and get instant visualizations or natural-language answers back, no dashboard-building required. And you're not stuck with a single query. You can ask follow-ups, drill into the details, and keep going until you have the answer you need.
How agentic AI changes data analytics
AI analytics solves one of the most persistent problems in data: making analytics work at the speed and scale of the business. AI data analysts can now handle the entire workflow, from understanding a question to returning a validated answer. Here's what that looks like in practice:
Complex questions get answered end to end
AI agents can now perform multi-step analysis, moving from what happened to why to what to do about it without waiting on an analyst. Take a product manager who notices engagement dropping in a key segment:
Instead of filing a ticket and waiting a week, they can ask the agent to identify which cohorts are affected, cross-reference the drop with recent release notes, and surface the features most correlated with the decline. What used to require an analyst, a data scientist, and days of coordination now happens in one conversation, with the full reasoning attached.
Plan with proactive insights
Agents don't just answer questions when asked, they can act on them on their own. Instead of waiting for someone to notice a problem, an agent watches the data continuously and surfaces the things that need your utmost attention.
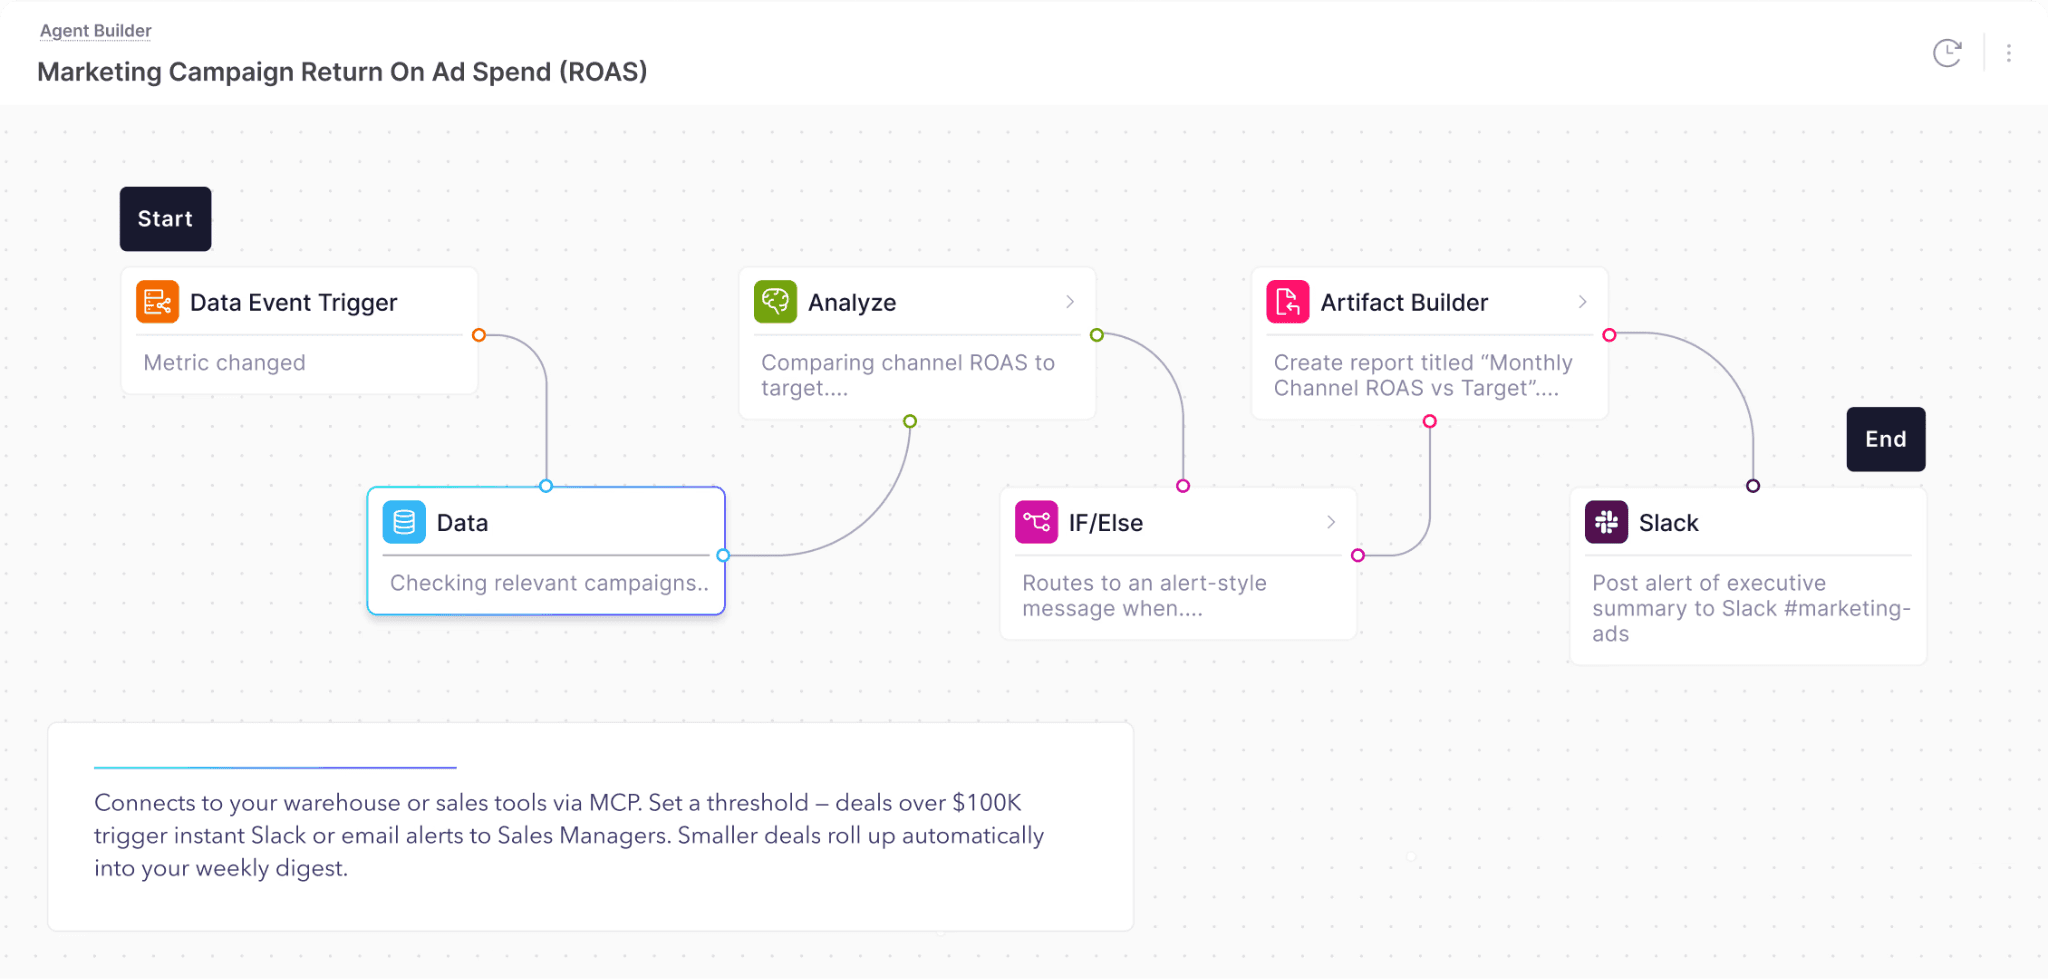
Agentic Analytics Platforms like WisdomAI take it further. Analytics Agents don't just monitor, they trigger the next step the moment a KPI shifts. Say a marketing team sets one up to track campaign performance across channels. The moment a channel drifts below benchmark, it flags the anomaly, surfaces the likely cause, and sends it straight to the team for review. Planning stops being reactive and starts happening in real time.
Analysts move from writing queries to shaping context
Analysts stop being the bottleneck between the business and the data. Their job shifts from producing answers to shaping the enterprise context that makes AI-generated answers trustworthy. This foundational work includes defining metrics, governing edge cases, and validating the reasoning behind AI outputs. It's a more strategic role with more leverage per hour.
Arm's procurement team, which manages sourcing for the chip architecture behind most of the world's phones, makes a good point about the shifting role in data teams today:
Interested in building these skills? Join our context engineering course.
Unstructured data finally becomes usable
Most data analysis today happens on structured data. But some of the richest business signal lives in unstructured sources: sales calls, support tickets, contracts, emails, meeting notes, customer reviews. All of this data packed with insight is not reachable by a SQL query.
Modern analytics tools change that. They can now read across your unstructured data alongside your structured tables, turning "we don't have data on that" into a reliable answer. A product manager investigating churn no longer has to guess whether support tickets and NPS comments back up the numbers. You get one connected view of what your customers are saying.
The catch: AI is only as good as its context
Agentic analytics is only as reliable as the context it operates on. Point an agent at an ungoverned data warehouse, and it will produce confident wrong answers at scale. Worse, if you don't actively manage that context, the answers you get are three months out of date. That's why context management can't be a one-time setup. It has to be treated like a continuous lifecycle.
ConocoPhillips saw this firsthand. Rolling out AI-powered analytics to over 2,000 engineers across 14 countries demanded a level of accuracy generic copilots couldn't deliver. WisdomAI's Adaptive Context Engine improved answer accuracy by 50% over their previous solution, giving them the confidence to scale self-service analytics across the entire engineering org.
How are enterprises using AI analytics?
Descope got 5x faster insight from their GTM data
Descope, a customer identity and access management platform, was scaling fast but running on slow data. Sales lived in HubSpot, quoting lived in the CPQ system, and other GTM signals were distributed across additional tools. Getting a complete picture meant pulling from each source separately, waiting on a data analyst to build a report, and circling back days later.
With WisdomAI, Descope unified their CRM and CPQ data into a single, queryable layer. Insights across CRM and CPQ come back 5x faster, and the team stopped waiting on reports to make decisions.
Patreon hit 9x self-service adoption in 3 months
Patreon, the platform connecting creators and their fans at global scale, had a familiar problem. Their data science team was buried in ad-hoc requests. Simple to mid-complexity questions from every corner of the business funneled through a small team that couldn't keep up, leaving decisions stalled and the data team stuck on routine queries instead of strategic work.
After rolling out WisdomAI, self-service analytics scaled from 50 users to 450 in just three months, with 95%+ accuracy on queries. Business users now pull live answers on their own and the data team is finally free to work on the analysis that actually needs their talent.
Agentic analytics is here. Are you ready?
To turn data into a true competitive advantage, it’s time to build a connected, active context ecosystem. The winners in 2026 and beyond won’t necessarily be the ones with the smartest models. They’ll be the ones who can feed their agents the right knowledge and context.
That's where WisdomAI comes in. Whether you're rolling out AI dashboards, Conversational BI, or Analytics Agents, every surface is grounded in your business logic. And the Adaptive Context Engine builds, continuously learns from, and governs that context. That means your agents stay accurate, trustworthy, and explainable as your business evolves.
Book a demo to see what agentic analytics looks like on your data.