Guide
7 ThoughtSpot alternatives for deeper data exploration
ThoughtSpot promised a "Google moment" for BI, where anyone could type a question and get an answer, just like you'd query the web. But there’s a massive gap between finding an answer and exploring a dataset.
ThoughtSpot works well at answering quick, direct queries. What it struggles with is everything that comes after the first answer. Testing a hypothesis, tracing an anomaly, connecting structured and unstructured data—this kind of work requires tools that let you pivot, probe, and follow a thread all the way through.
These eight ThoughtSpot alternatives are for teams ready to move from reporting to complex data analysis.
ThoughtSpot is good for dashboards, but what about depth?
ThoughtSpot runs into a familiar self-service BI problem: It works well for questions your data team has already modeled. The moment you venture outside that scope, exploration stalls and you’re back to filling tickets.
For data teams, the frustration only grows. Formula configuration is slow, and the tool rejects valid syntax without explanation—a pattern that shows up consistently in user reviews.
Another important point: ThoughtSpot has a semantic layer that makes queries consistent, but it lacks a broader context layer that includes data lineage, governance rules, and decision precedents. That means you're always at risk of hallucinations and policy violations—Spotter (Its AI assistant) can answer your question, but it can still hallucinate or break your compliance rules.
The verdict: ThoughtSpot's interface is clean. For teams with well-defined reporting needs, this setup works. The limitations become visible when the work shifts toward open-ended exploration.
What ThoughtSpot does well
Spotter (ThoughtSpot’s AI agent): Automatically surfaces insights, detects anomalies, and predicts trends in your data.
Interactive visuals: Real-time dashboards with real-time drill-down, dynamic updates, and clean visualizations.
Enterprise-scale data connectivity: Connects to cloud warehouses, on-prem systems, and legacy databases with enterprise-grade governance and security
Where ThoughtSpot falls short
Limited query precision: Natural language searches struggle with complex questions, often returning incomplete results due to limited knowledge of the dataset's structure.

Source: G2
Steep learning curve: AI and search features require training before non-technical users can get real value from them.
Customer support delays: Response times during configuration and setup can be slow, reducing confidence at the discovery stages.
Comparing ThoughtSpot alternatives: Fit, pricing, and AI features
Not every ThoughtSpot alternative is built equally. Some score better on visualization, others on data unification, and a few are moving toward agentic AI that investigates problems rather than just answering questions. Here's a quick comparison before we go deeper:
Tool | Best for | Deployment | AI and automation | Pricing | Why it stands out |
WisdomAI | Context-aware agents that automate analytics and deliver accurate, enterprise-ready insights. | Cloud | Analytics Agents that break down complex questions, query across disparate sources, and interpret the results so you don't have to. | Custom | Goes beyond the first answer to investigate what's actually driving the outcome. |
Domo | Data unification across a fragmented stack. | Cloud | Natural language queries and dashboard building. | Consumption-based pricing | Pulls everything into one place, then lets you explore it. |
Tableau | Visual exploration of complex datasets. | Cloud and On-Prem | Einstein AI for natural language and trend detection. | Per user, tiered pricing | The most flexible visual exploration layer in the market. |
Qlik Sense | Understanding complex relationships in your dataset. | Cloud and On-Prem | AI-assisted insights and natural language queries. | Per user, tiered pricing | Advanced data transformation and modeling capabilities. |
Klipfolio | Highly customized dashboards. | Cloud | Auto-generated summaries and visualizations. | Per user, tiered pricing | Granular control over how data is displayed and calculated. |
IBM Cognos Analytics | Advanced reporting with AI exploration on top. | Cloud and on-prem | Natural language queries and smart Exploration. | Per user, tiered pricing | Automatically analyzes data and supports predictive modeling. |
Looker | Organizations where conflicting metric definitions are the real problem. | Cloud | Gemini-powered conversational analytics. | Custom | LookML lets you define data relationships and business logic. |
We cover each tool in depth below. For a broader view, here's a complete BI tools comparison.
1. WisdomAI: Best for automating multi-step analysis
WisdomAI moves analytics from search to reasoning. ThoughtSpot is built around a search bar and a structured data model where you can ask questions, but only about the data your analysts have already modeled and prepared.
WisdomAI connects both structured and unstructured data sources into a single analytics layer, so decisions are based on everything happening in your business.
Analytics Agents run multi-step analyses automatically—anomaly detection, trend analysis, root cause—without your team having to set any of it up. And because every analysis runs through the Adaptive Context Engine, the results are grounded in your actual business logic.
Key features
Conversational BI: Ask questions in plain English, get answers as text, visuals, or reports.
Analytics Agents: Monitor metrics, detect anomalies, and automate recurring reports.
Complex workflows: Model and deploy complicated workflows with conditions, loops, Human-in-the-Loop, and actions. Analytics Agents don't lose context between steps in long workflows.
Adaptive Context Engine: Grounds every answer in your business logic, metric definitions, and source relationships.
Pros
Delivers real-time, AI-generated insights through multiple specialized agents.
Answers are grounded in your business logic, not generic model assumptions.
Works across structured and unstructured data sources.
Recurring analysis and reporting runs automatically once set up.
Cons
No published pricing—you'll need to contact sales to get a number.
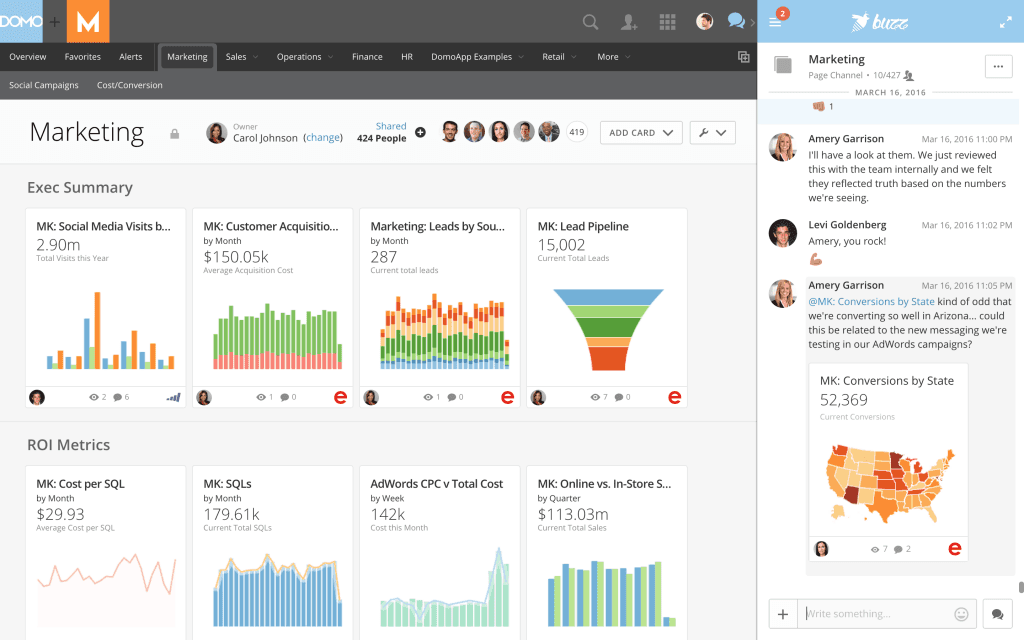
2. Domo: Best for data unification
Domo's strongest argument for being on this list is connectivity. While ThoughtSpot assumes your data team has already centralized your data, Domo pulls it together into one governed layer. It handles the fragmented-stack problem that causes most BI tools to return partial answers. For large organizations drowning in siloed systems, this breadth matters.
It's a strong consolidation tool that's getting better at exploration. Though teams that need deep, multi-step analysis will still hit limits.
Key features
Data connectivity: Over a thousand connectors across cloud, on-prem, and APIs
AI agents and automation: Automates workflows, generates forecasts, and surfaces predictive insights
Spreadsheet-native exploration: Interact with governed data in a familiar interface.
Embedded analytics: Push analytics into the applications your team already uses.
Pros
Breadth of data connectivity is hard to match.
Intuitive dashboards for fast, clear visualization.
Workflow automation reduces manual reporting overhead.
Cons
Steep learning curve for new or casual users.
Customization of reports and visuals is more limited than competitors.
Pricing scales quickly for smaller organizations.
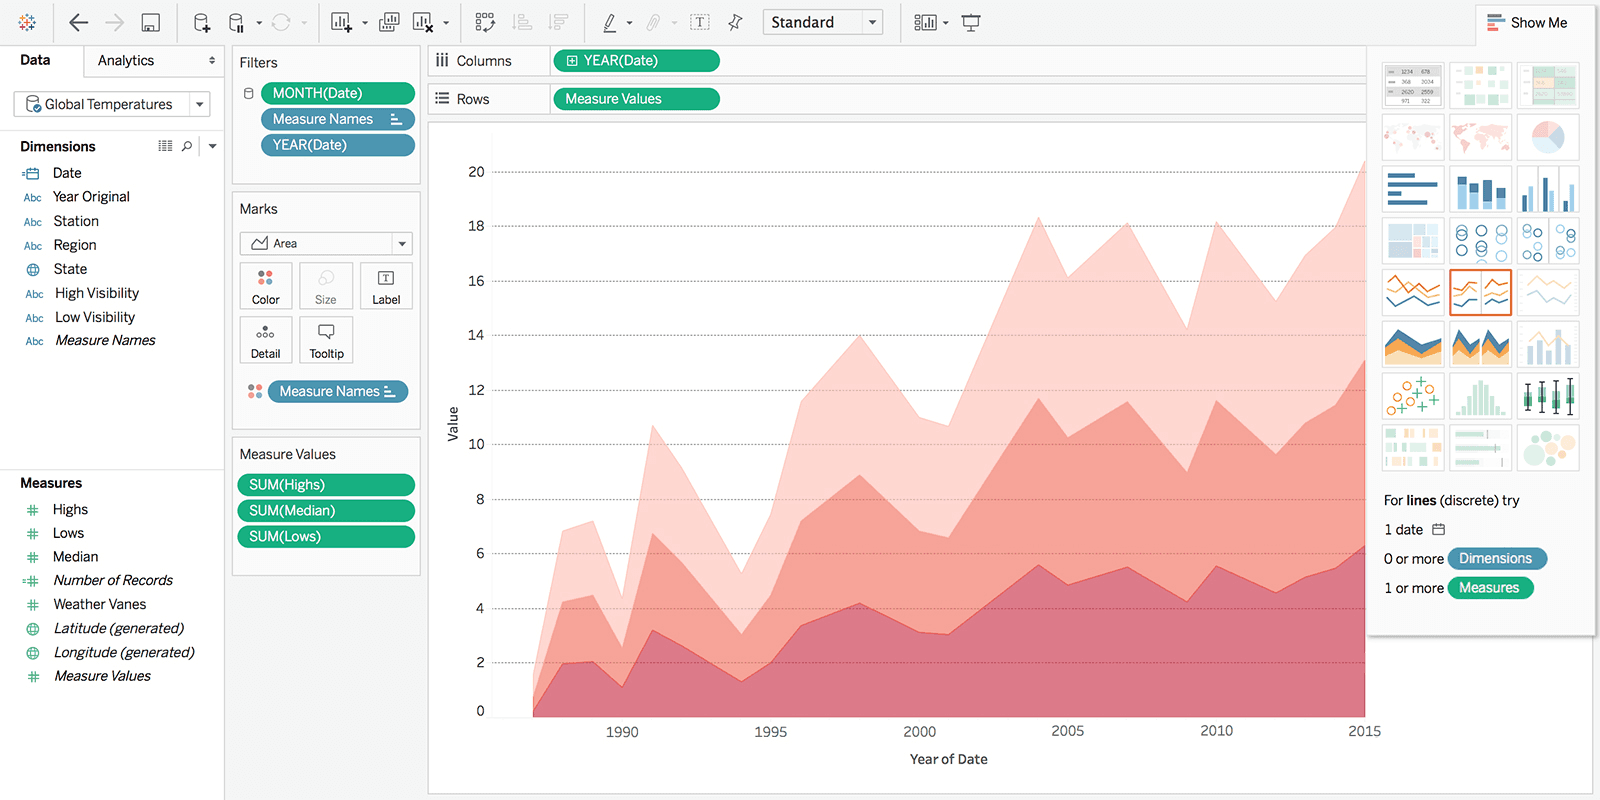
3. Tableau: Best for visual exploration
Tableau is the benchmark for visual data exploration. Its core strength is letting analysts interact with data the way they think—building views, layering dimensions, following visual threads—rather than filling in a query form. If your team needs to see data from multiple angles before knowing what question to ask, Tableau's drag-and-drop interface gives them the space to do that.
The Einstein AI layer adds natural-language querying and automated trend narratives via Tableau Pulse. But it’s worth noting that Tableau is still fundamentally a visualization-first tool. The AI sits on top of a manual workflow rather than driving it.
Key features
Visual exploration: Drag-and-drop interface for building views, layering dimensions, and following data threads.
Einstein AI: Natural language querying, automated narratives, and trend detection.
Governed data environment: Built-in monitoring, identity integration, and compliance controls.
Flexible deployment: Tableau Cloud, Tableau Server, or Tableau Desktop.
Pros
Flexible visual exploration layer.
Drag-and-drop interface works well for analysts.
Strong community and learning resources.
Cons
Performance degrades noticeably with large datasets.
Licensing costs climb fast once you start using Tableau Pulse.
Business users struggle with anything beyond pre-built dashboards.
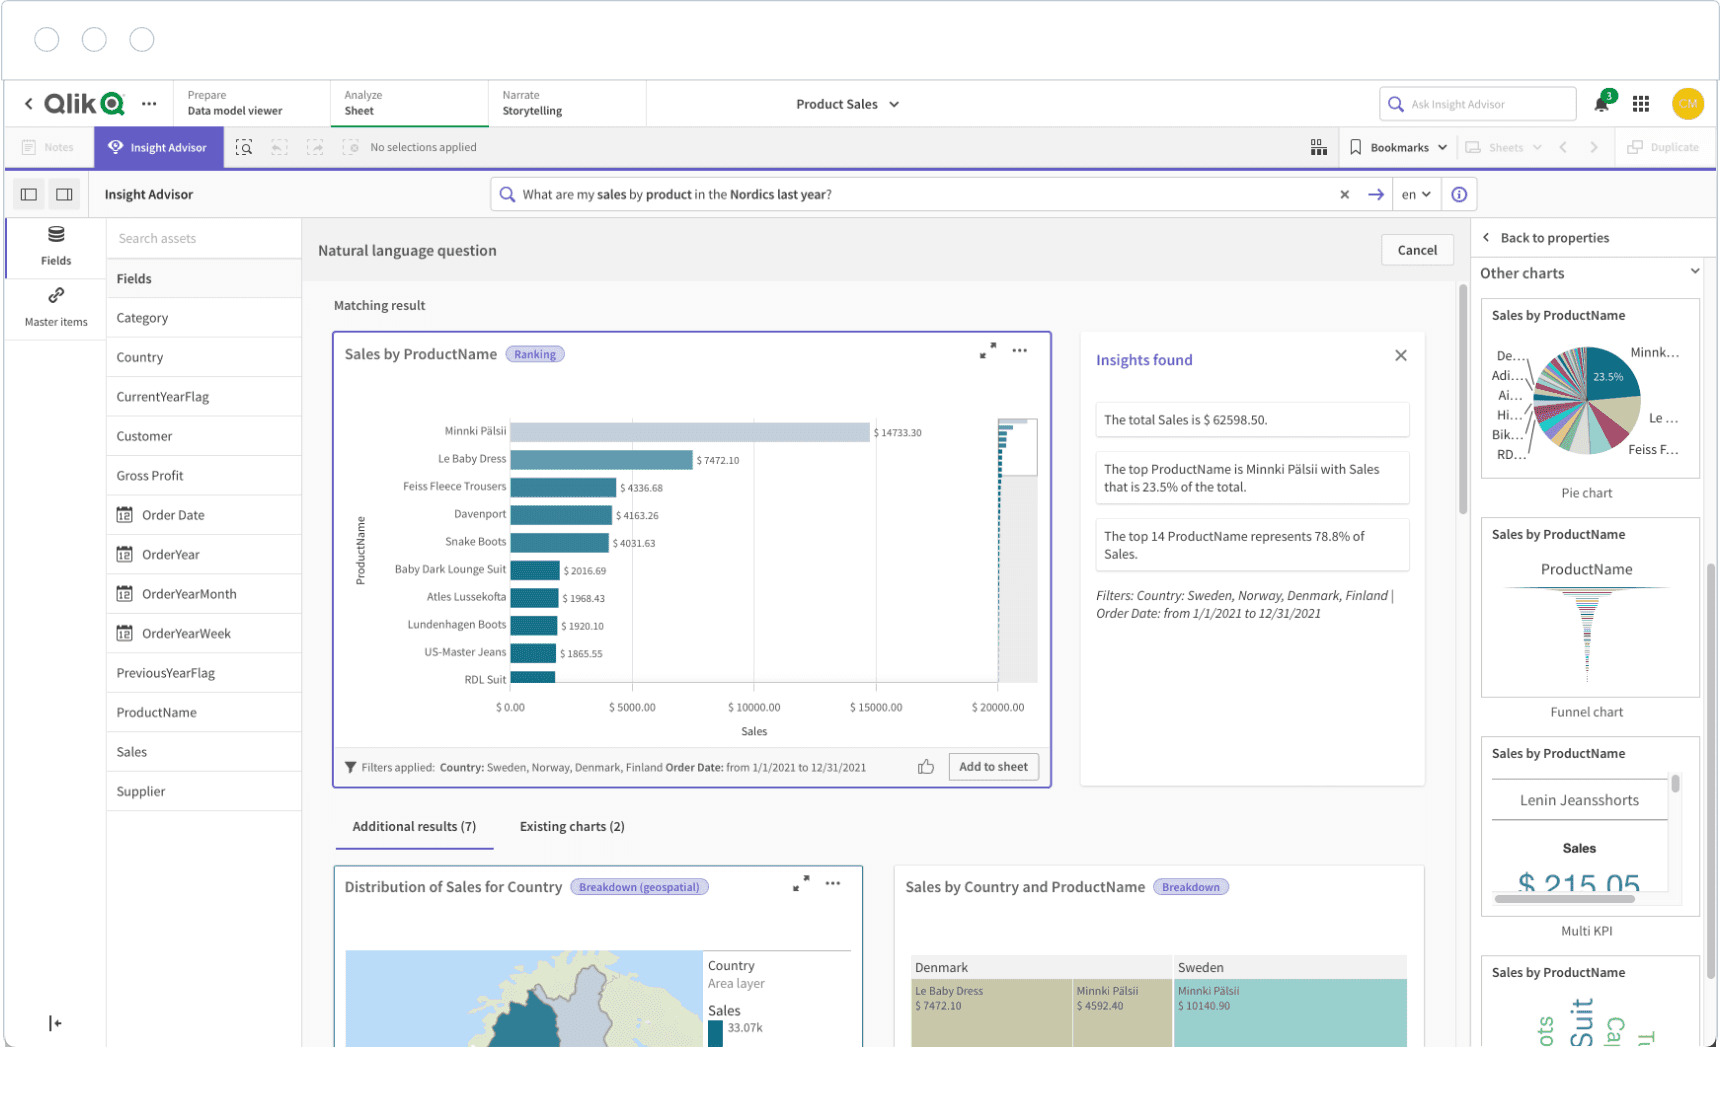
4. Qlik Sense: Best for free-form exploration
ThoughtSpot and Qlik Sense look similar on the surface—both accept natural language questions, and sit on top of your data warehouse. But the underlying architecture is completely different.
Qlik offers an associative engine that allows you to make a selection anywhere in your dataset, and the entire view updates instantly. You can click any value, such as a region or a product, and the entire dataset updates instantly to show how it connects to everything else.
This freedom comes with a tradeoff, though. Qlik takes longer to learn than ThoughtSpot. If your team needs a tool with a faster setup, this won't be the right fit.
Key features
Associative engine: Data selection updates the entire dataset instantly.
AI-assisted insights: Automates pattern detection, insight suggestions, and natural language querying across datasets.
Real-time alerting: Triggers event-driven actions across connected systems.
Embedded analytics: APIs and developer tools for embedding analytics into applications and custom workflows.
Pros
Explore data in any direction without predefined query paths.
AI-assisted insights that surface patterns.
Fast dashboard creation with strong data integration.
Cons
Performance degrades with large or complex datasets.
The associative model takes time to learn.
Export options and map functionality lag behind competitors.
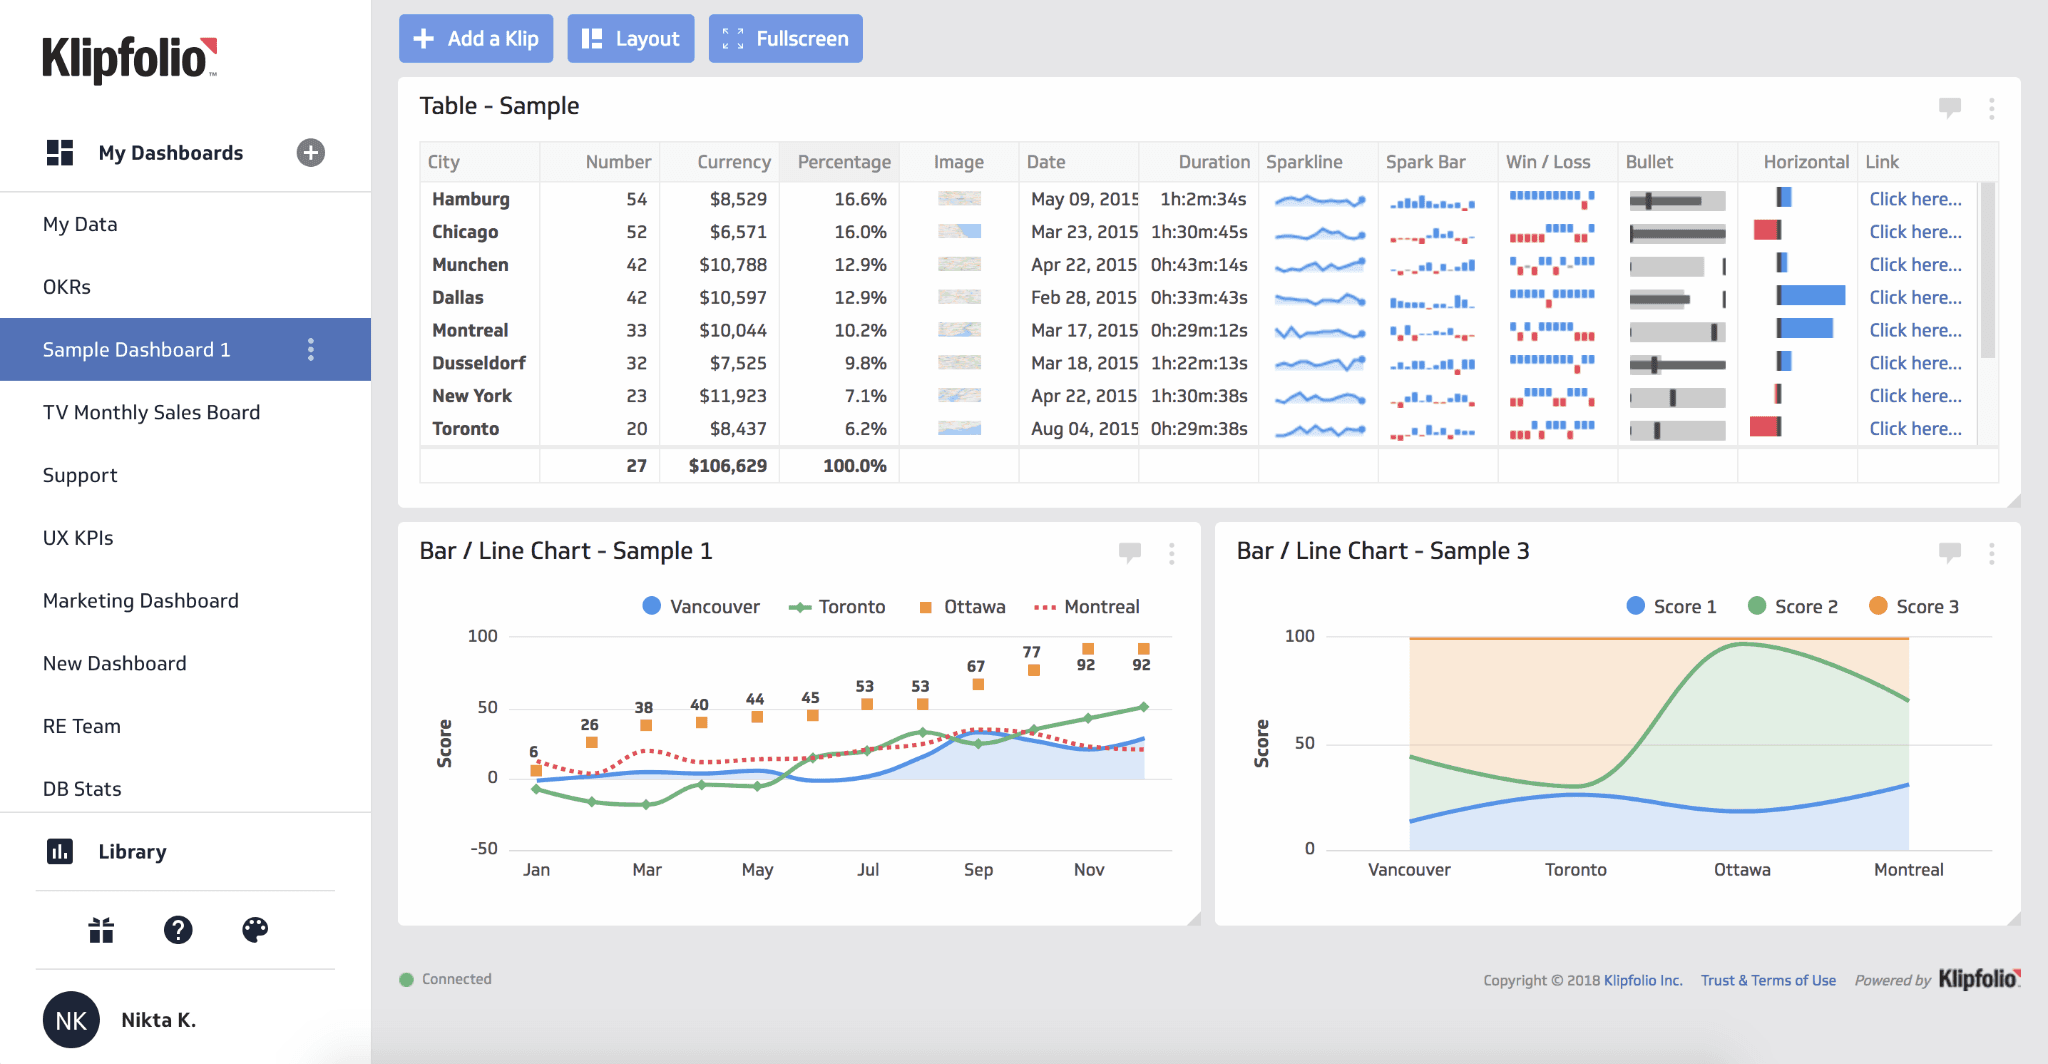
5. Klipfolio: Best for highly customized dashboards
Where ThoughtSpot is built for business users who want fast answers, Klipfolio is built for technical teams who want complete control over how data is displayed and calculated. It connects to REST APIs, SQL databases, and spreadsheets, and supports HTML, CSS, and custom formulas for teams that need precision over simplicity.
PowerMetrics, Klipfolio's newer product, adds an AI layer that generates visualizations from natural language prompts. For technical teams, Klipfolio is one of the most flexible tools on this list. For everyone else, it's one of the most frustrating. The experience varies widely.
Key features
Broad data connectivity: Multiple data sources, including APIs, SQL, spreadsheets, and FTP.
Custom visualization editor: Build dashboards using drag-and-drop and custom formulas.
PowerMetrics AI: Generates visualizations from natural language prompts.
Real-time refresh: Dashboards stay current with automatic data updates.
Pros
Build dashboards exactly to spec using HTML, CSS, and custom formulas.
Wide data source coverage across APIs, SQL, spreadsheets, and FTP.
Large library of pre-built templates.
Cons
Steep setup and learning curve for non-technical users.
Fewer AI capabilities than most tools on this list.
Customer support response times can be slow, particularly for technical configuration issues.
6. IBM Cognos Analytics: Best for governed reporting
IBM Cognos Analytics is one of the more mature platforms on this list. While ThoughtSpot is built for speed, IBM Cognos is built for compliance-heavy organizations where the answers need to be auditable, governed, and trusted at scale.
The governed reporting infrastructure offers centralized audit trails, fine-grained access controls, and certified data models built for compliance-heavy environments. The AI layer removes the need for SQL through natural language querying and applies time-series modeling to historical data to project future trends.
Cognos works exceptionally well for organizations with mature data governance. If that's not where your team is yet, the setup complexity will slow you down.

Key features
Natural language querying: Ask questions in plain English and get answers as visualizations or reports.
Smart Exploration: Automatically analyzes what drove a change in your data.
Predictive forecasting: Applies time-series modeling to project trends and predict outcomes.
Governed reporting: Centralized audit trails, fine-grained access controls, and certified data models for compliance-heavy environments.
Pros
Automatically explains what drove any data change
Enterprise-grade governance and compliance controls.
Support for predictive modeling and forecasting.
Cons
Steeper learning curve than most tools on this list.
Overkill for smaller or lighter-weight teams.
Performance slows under complex queries or large datasets.
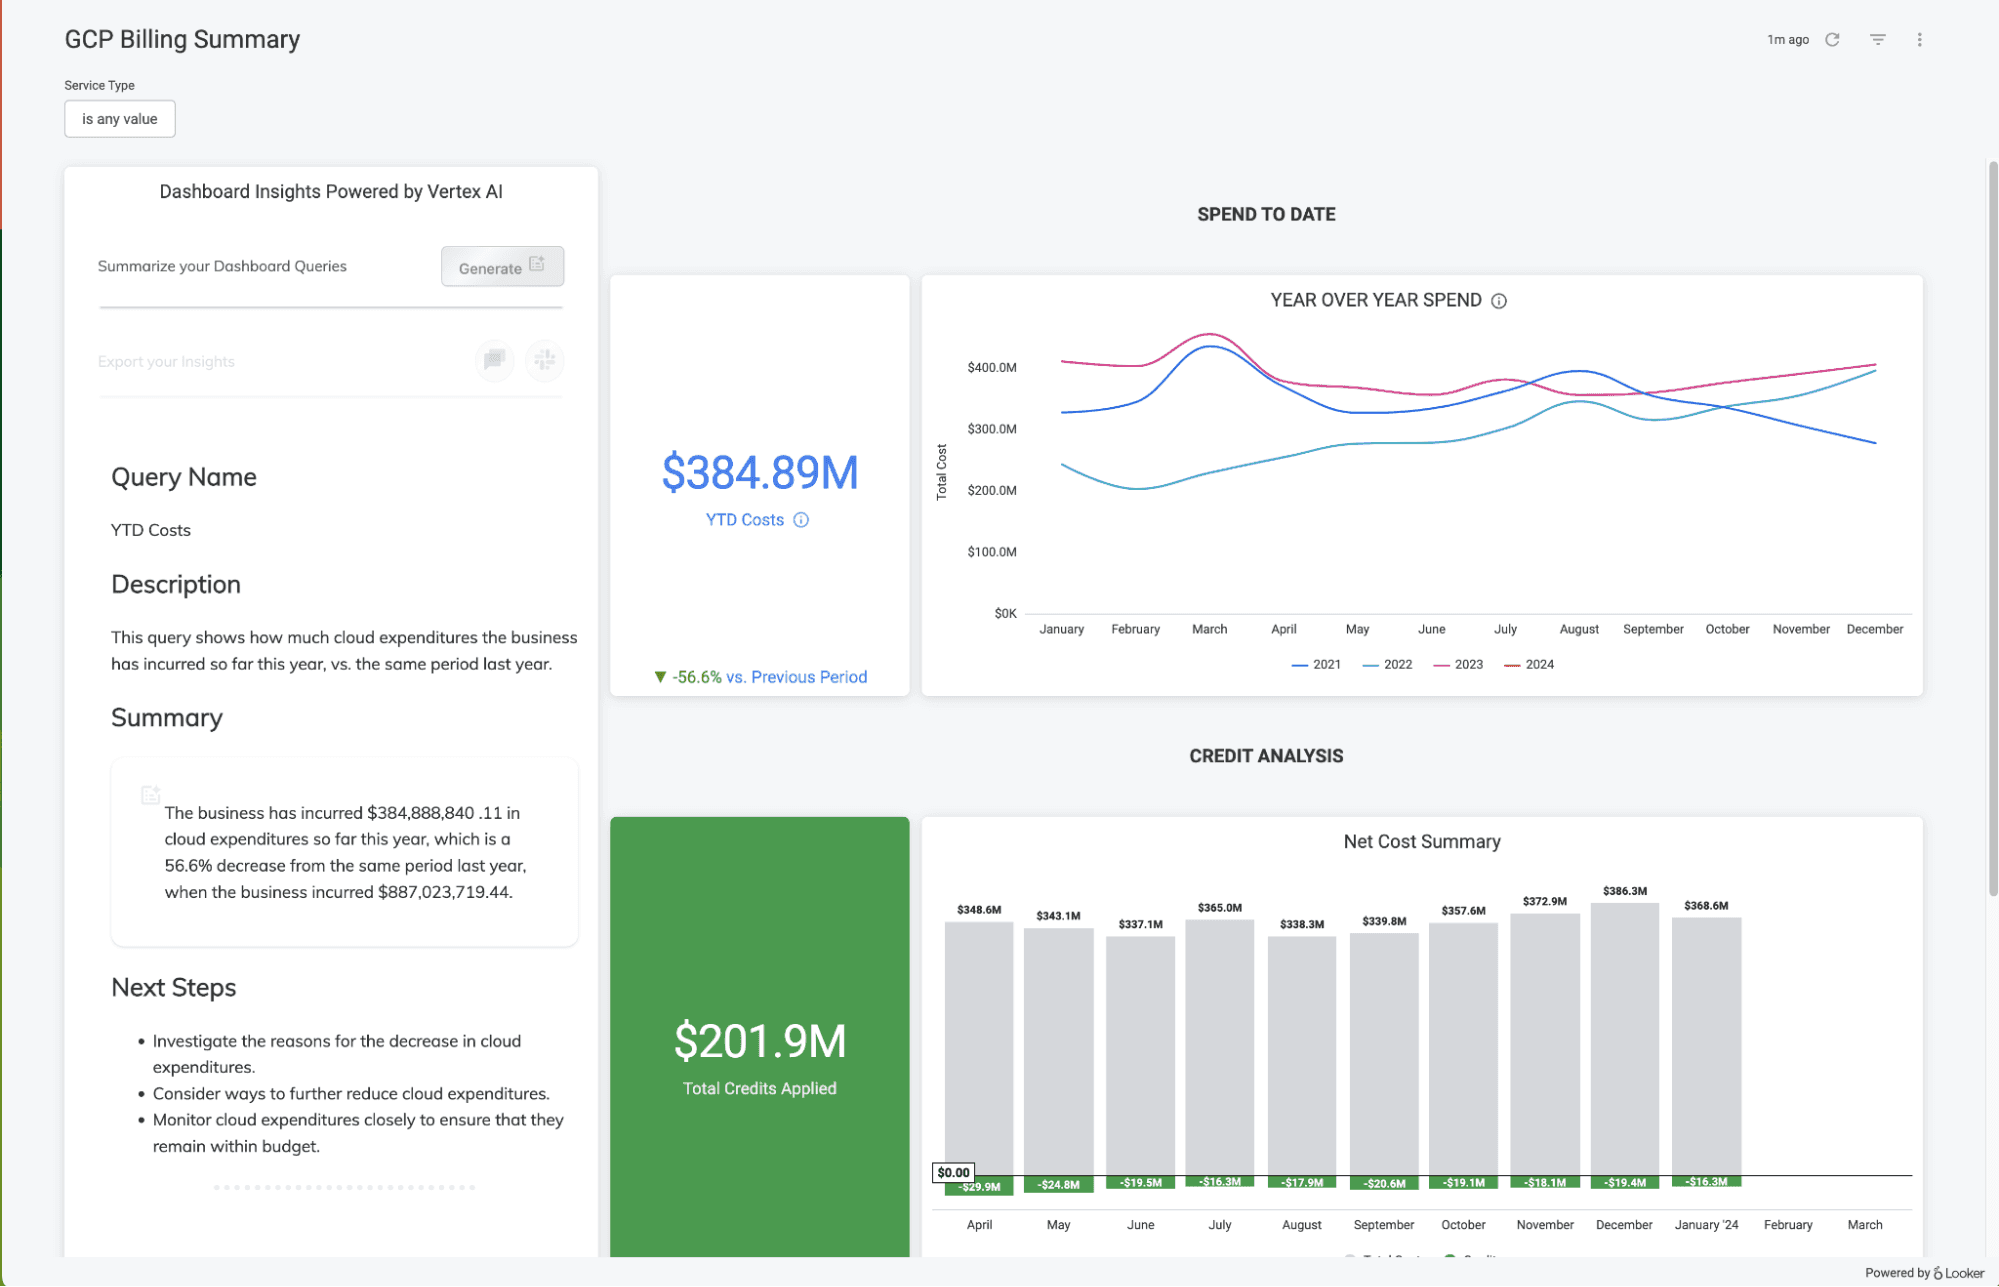
7. Looker: Best for consistent metrics across a large organization
Google’s Looker is the second governance-heavy platform on this list, and it earns its place for a different reason than Cognos. Where Cognos is built around compliance and auditability, Looker is built around metric consistency, making sure every team works from the same definition of the truth.
It does this through LookML, where data relationships and calculations are defined once and every dashboard, query, and report inherits the same logic.
The catch is set up. Looker needs a strong data model before it delivers, and building that model takes time and technical investment.
Key features
LookML modeling: Define data relationships and business logic once in code.
Gemini-powered conversational analytics: Translates natural language questions into governed SQL queries.
Embedded analytics: Enterprise-grade embedding with full row-level security.
Flexible deployment: Fully cloud-native, with deep integration across Google Cloud and BigQuery.
Pros
One definition of each metric is inherited across all teams and dashboards.
Natural language queries that return consistent answers.
Deep integration across Google Cloud, BigQuery, and the broader Google ecosystem.
Cons
Requires significant upfront modeling investment before exploration feels fluid.
Performance issues with large or complex datasets.
Pricing lacks transparency. The total cost of ownership is harder to estimate than that of competitors.
Every unanswered question costs you something
Most BI tools have gotten very good at building dashboards. But that was never the bottleneck. The real problem was always the wait between a question and an answer.
ThoughtSpot narrowed that gap. WisdomAI closes it.
Ask a question in plain English across structured and unstructured data and get an answer with the reasoning behind it. No lost context, no requests filed, no waiting on anyone. And when you need to dig deeper, Analytics Agents run root cause, anomaly detection, and trend analysis automatically — grounded in your actual business logic.
See how WisdomAI helps your team decide faster. Book a demo.