Guide
The 2026 Looker Alternatives Guide
Most teams leave Looker for the same handful of reasons: the cost, the LookML tax, and the slow path from question to answer. If any one of these sounds familiar, it's smart to explore your options.
This guide walks through eight Looker alternatives, covering what each one does well and where it falls short, so you can figure out which ones are actually worth your time and consideration.
Looker nails semantic modeling. But self-serve is another story.
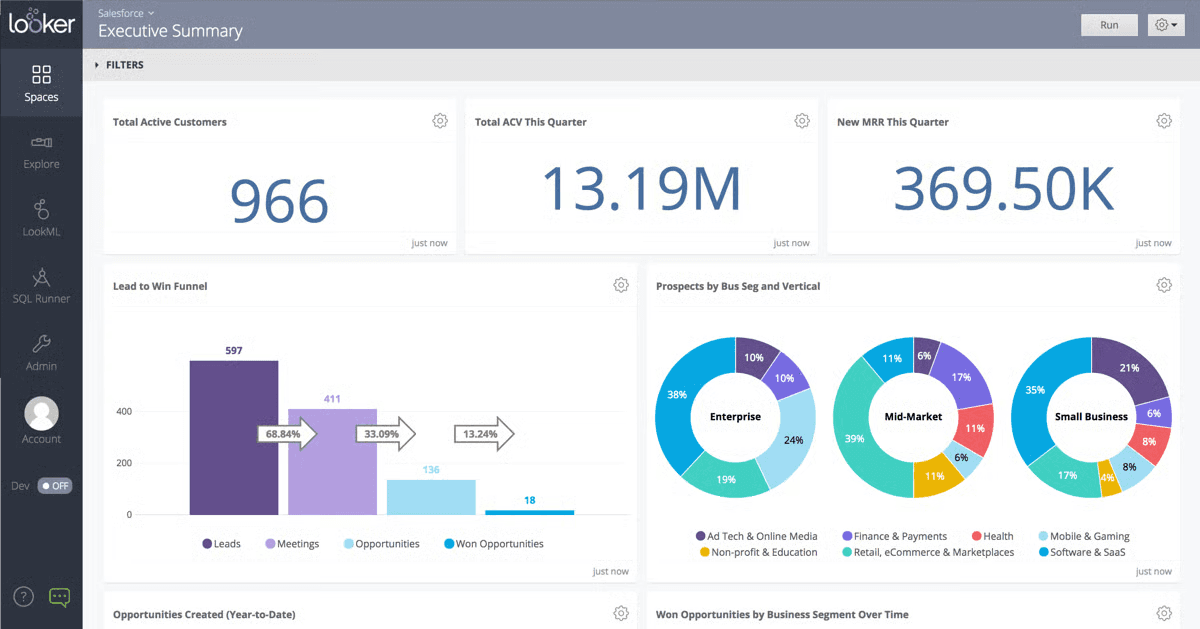
Looker is Google Cloud's BI platform for exploring, visualizing, and operationalizing your data. Its real differentiator is LookML — a proprietary modeling language that lets data teams define metrics once and keep them consistent across dashboards, giving every team a shared definition of "revenue," "active user," or "churn." However, even this strength can become a challenge as context decays and metric definitions change.
This consistency is Looker’s real strength. The trade-off shows up when your team has new questions about data that isn't already in the model. In this case, getting an answer means asking an analyst to model it first. A decision maker’s request is then filed in a queue, and the business loses an opportunity for a data-driven decision. Although Gemini's natural-language queries help within the modeled data, anything outside it still runs through the same queue.
That’s Looker’s self-service ceiling.
What Looker does well
AI-powered analytics (Gemini): An AI assistant baked in for visualizations, reports, and modeling tasks within the Looker environment.
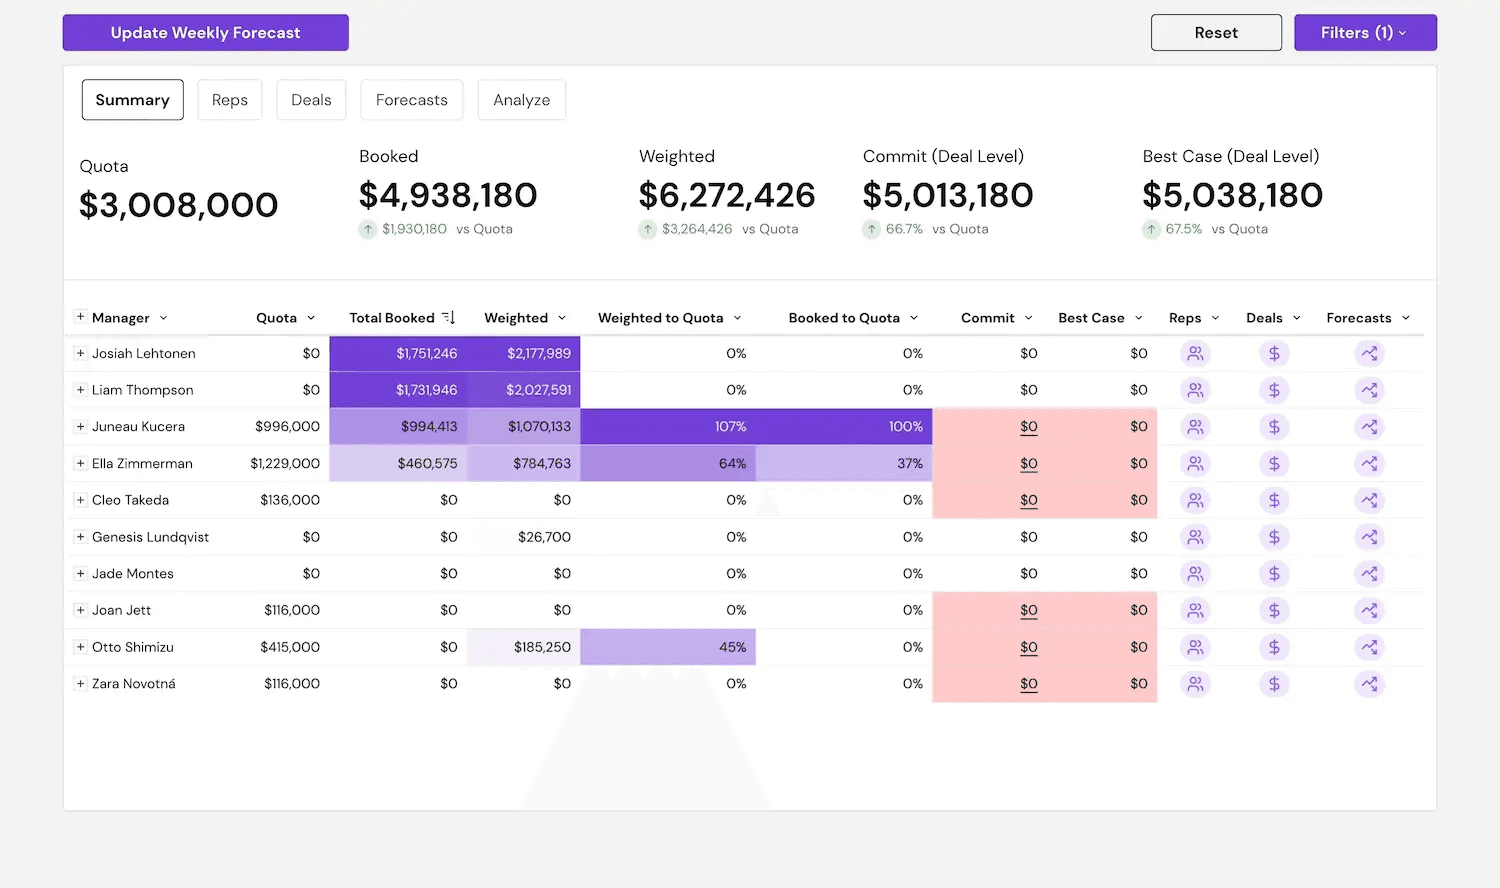
Interactive dashboards: Real-time dashboards that refresh as the data changes.
Native BigQuery performance: Built to work closely with BigQuery, where you can run queries directly against the warehouse.
Embedded analytics: APIs and extensions for embedding dashboards into customer-facing apps.
Vertex AI integration: Integrates with Google's broader AI stack for teams running advanced analytics workflows.
Where Looker falls short
Limited support for unstructured data: Mainly focuses on structured data, with limited support for unstructured data or conversational query experiences.
Steep learning curve: Business users can't explore new data without an analyst first modeling it in LookML. G2 reviewers consistently flag the LookML learning curve as a barrier, especially compared to tools like Power BI, Tableau or more modern solutions.
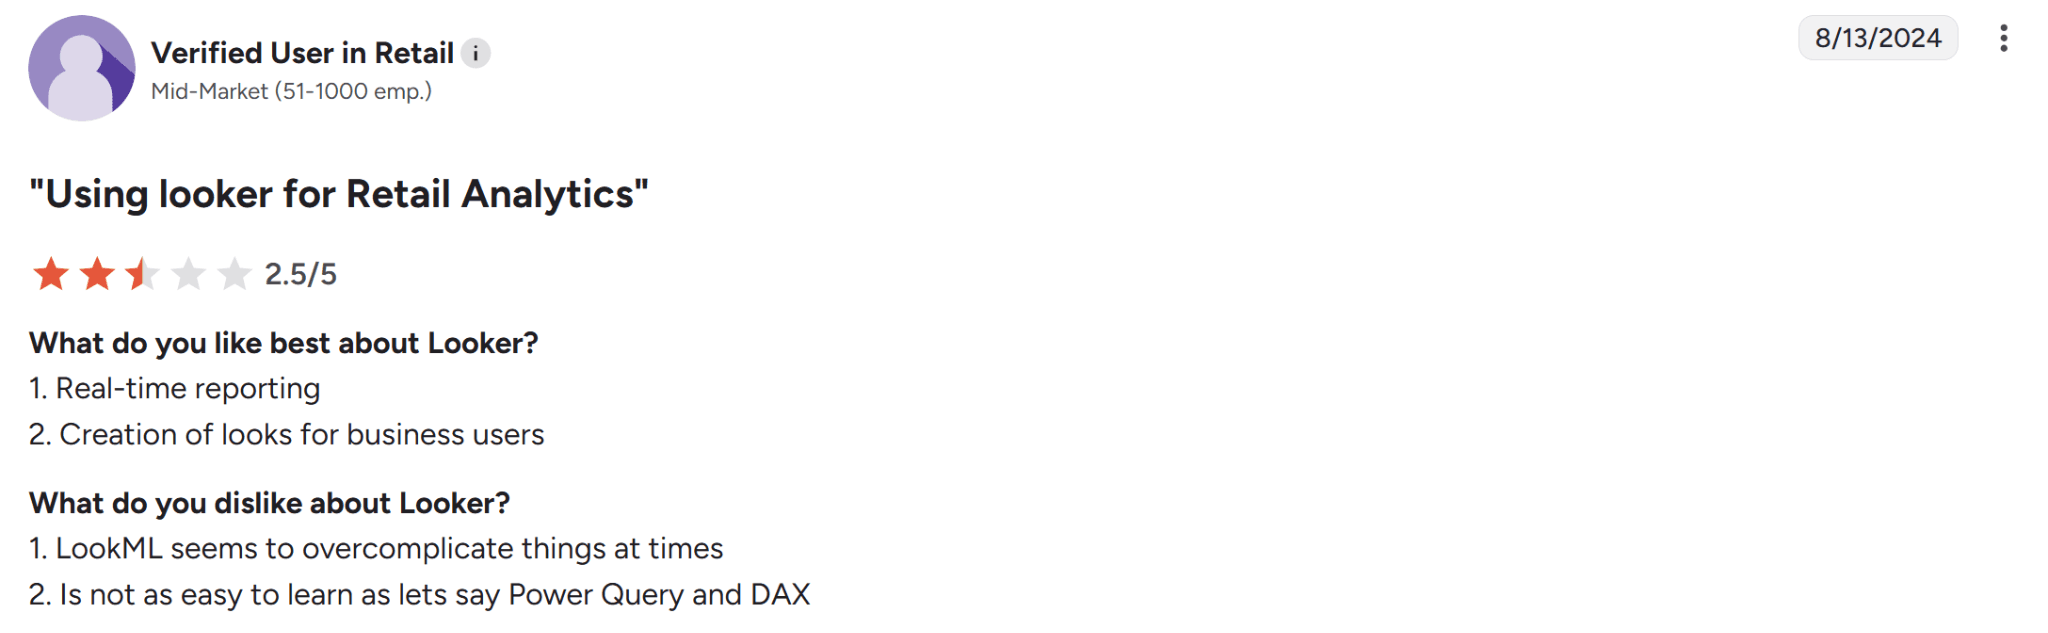
Source: G2
Performance issues: User reviews on G2 consistently flag slow load times, especially for dashboards with many tiles or high-cardinality data.
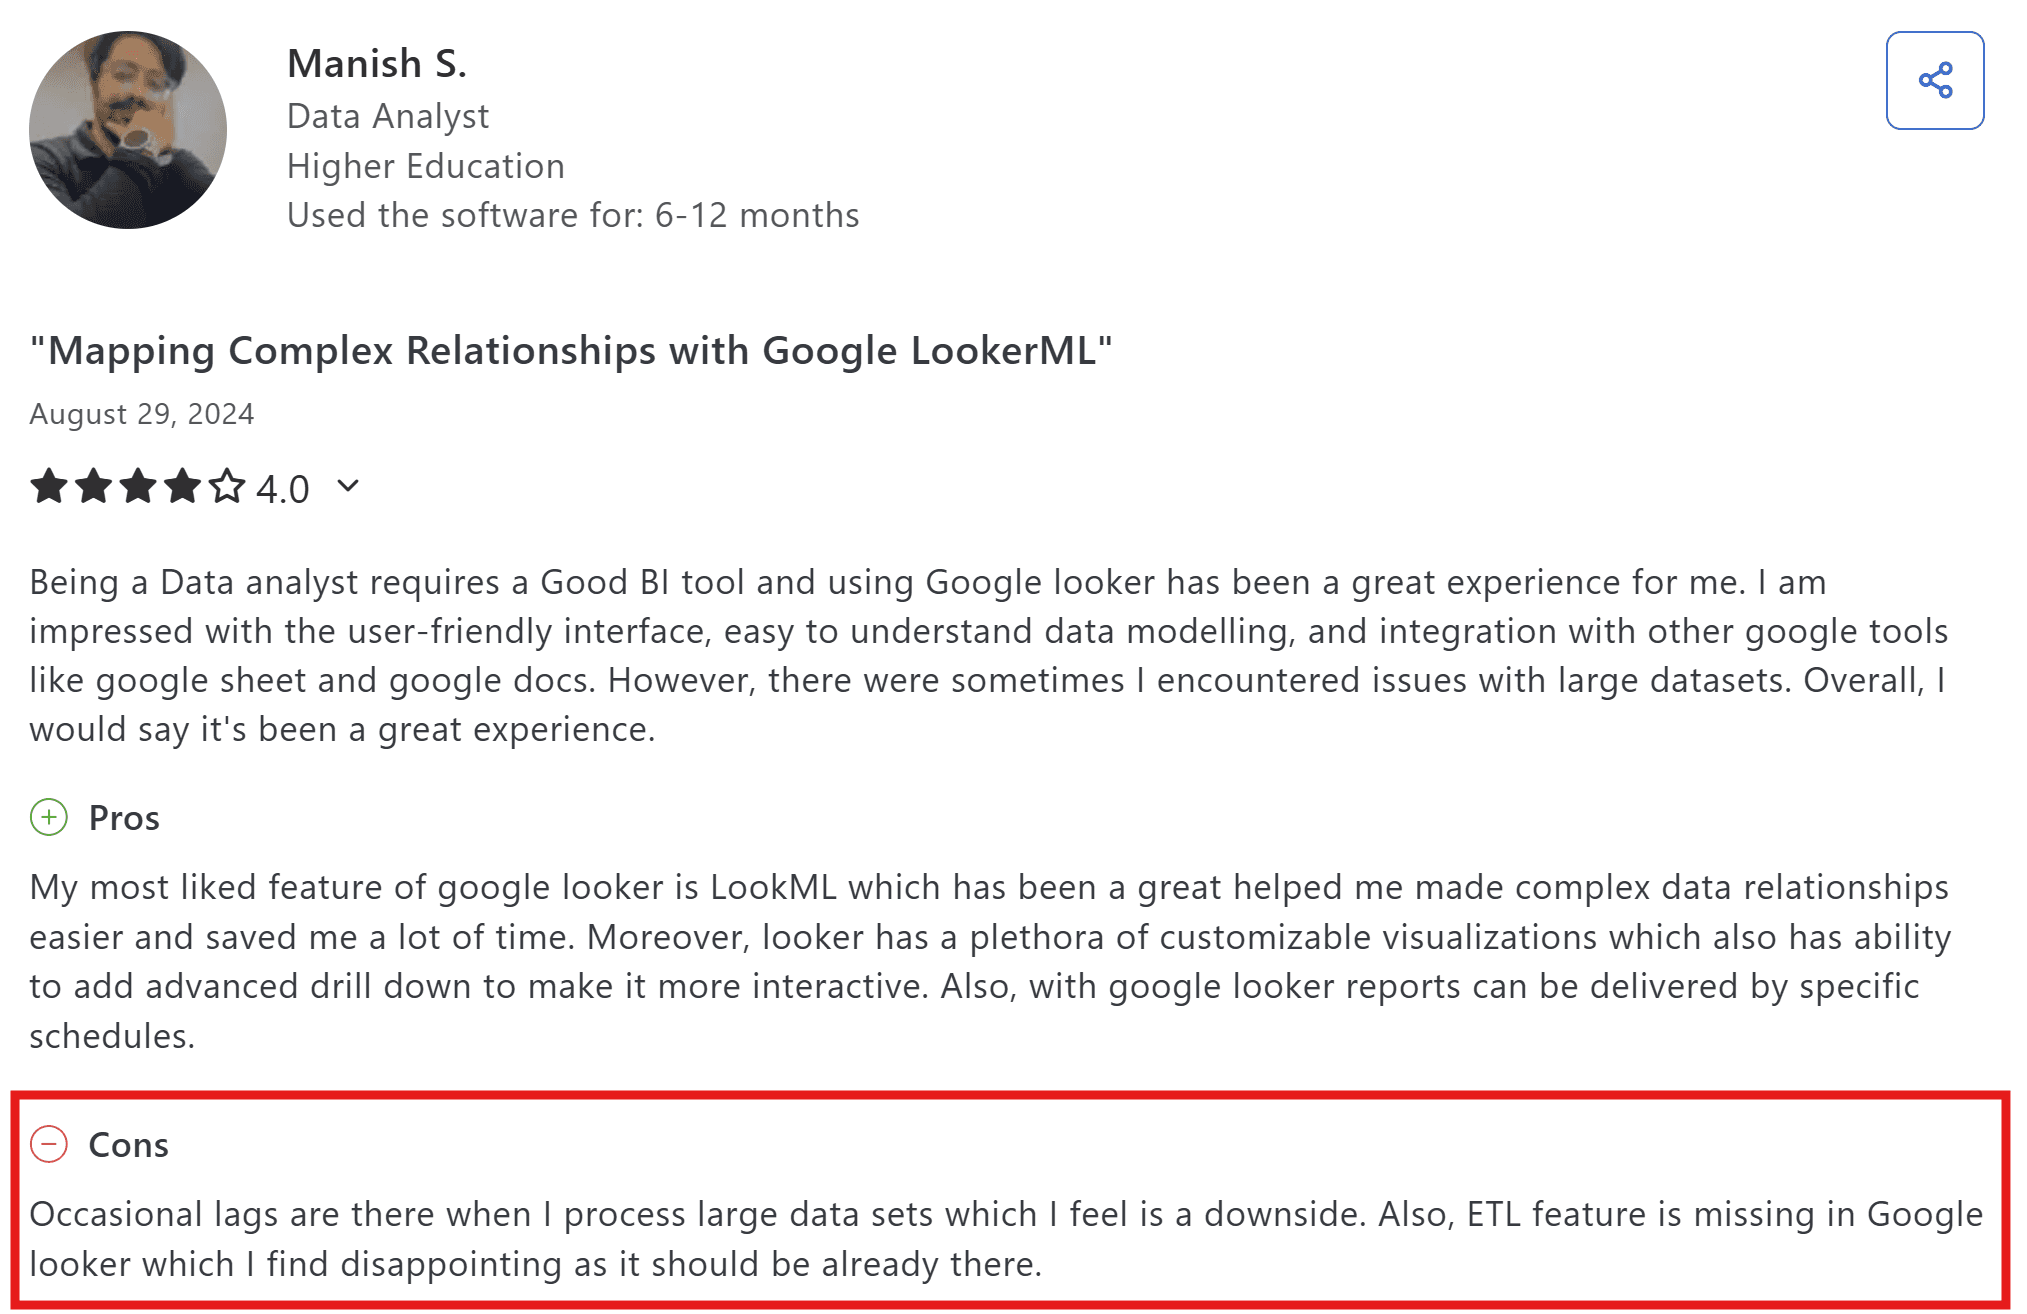
Source: G2
Basic visualizations: Compared to Tableau or even Power BI, Looker's built-in visualization library is limited. Custom visualizations are possible but require significant development work.
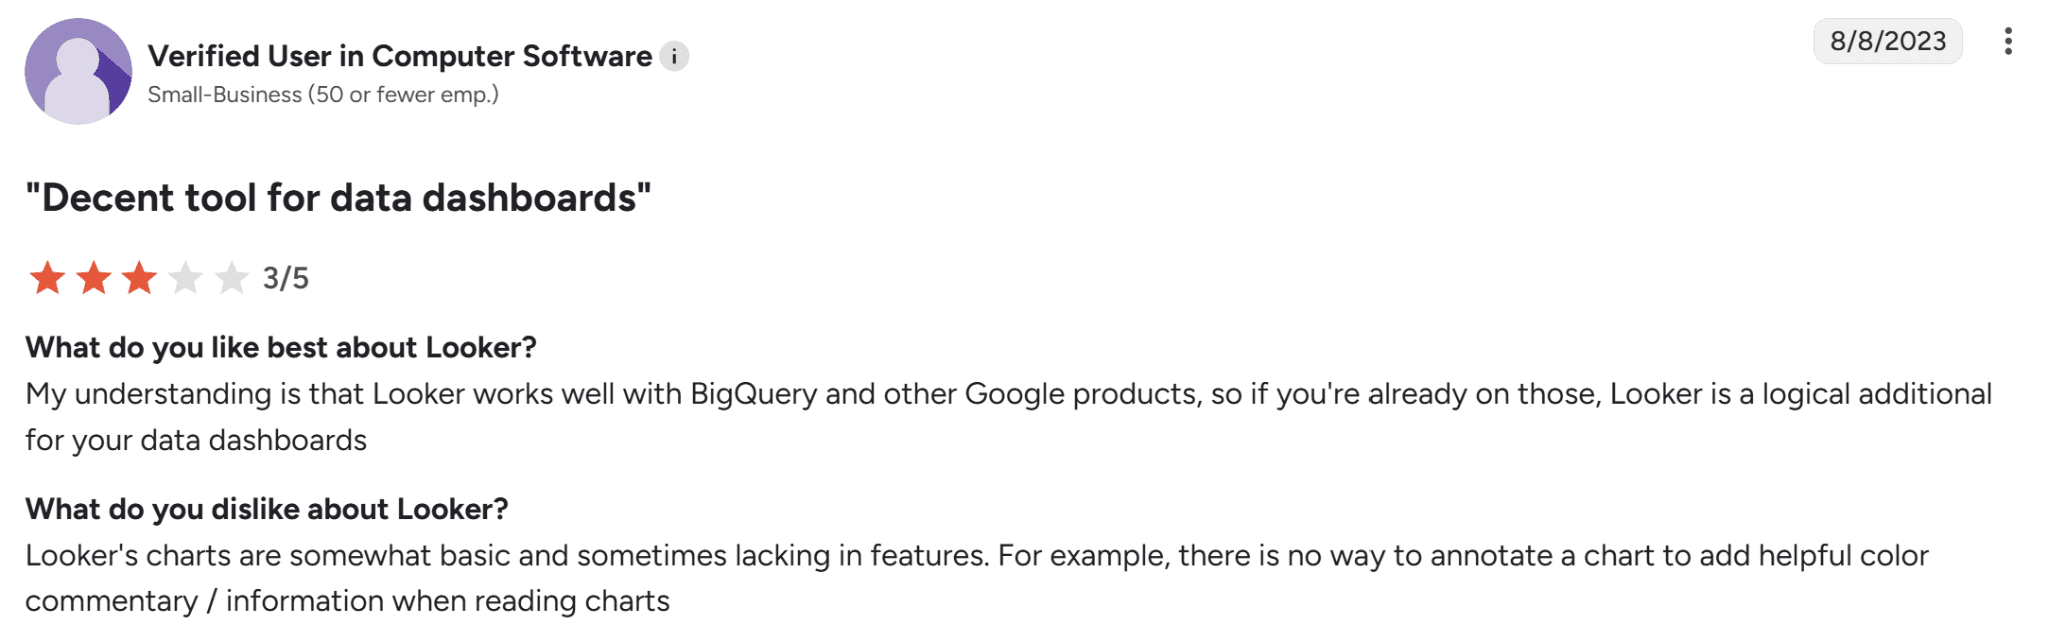
Source: G2
Hidden usage expenses: Beyond licensing, users note that scaling Looker brings additional costs, particularly for connectors and infrastructure.
8 Looker Alternatives Compared: Pricing, Features, and Fit
Tool | Best for | AI and Automation | Deployment Options | Starting Price |
WisdomAI | Agentic intelligence across all your data | Proactive agents answer your questions across structured and unstructured data | Cloud / On-Prem | Custom pricing |
Sigma Computing | Spreadsheet-style BI for finance and ops teams | Predictive analytics & machine learning | Cloud / Warehouse-based | From $300/month |
Domo | Real-time reporting | AI‑driven automation | Cloud | Custom (usage‑based) |
Power BI | Microsoft-shop BI | Copilot integration with DAX and Power Query for modeling | Cloud / Hybrid | $14/user (Pro) |
Apache Superset | Engineering-led open-source BI | No native AI; community plugins available | Self-hosted | Free (open-source) |
Metabase | Lightweight BI for small teams | Metabot for natural-language queries | Cloud / self-hosted | Free; paid from $100/month |
Tableau | Visual storytelling | Tableau Pulse and Einstein Copilot for AI-assisted exploration | Cloud / On‑prem | From $75/creator/month |
Holistics | Code-driven BI with dbt integration | AI-assisted insights on a code-based modeling layer | Cloud / On-prem | From $960/month |
We'll go in-depth about how each tools works below, but you can also find a complete BI tools comparison here.
1. WisdomAI
WisdomAI takes a different approach to analytics. Looker is built around dashboards and a governed semantic layer where you can only explore the data your analysts have modeled.
WisdomAI is built around chat, augmented dashboards, and AI agents, all field by the Adaptive Context Engine. With chat, you can answer questions in natural language across structured and unstructured data. Meanwhile, you can build agents to monitor metrics proactively and surface insights before anyone has to go looking.
The agents are grounded in WisdomAI's Adaptive Context Engine (ACE), which codifies business definitions, reconciles conflicting metrics, and gives the AI the shared context it needs to deliver accurate answers. The result: your team gets trusted answers in minutes, not days.
Key Features
Conversational BI: Ask business questions in everyday language and get instant insights from any data source.
Proactive insights agent: Continuously scans your data for anomalies and delivers alerts in real time, so your team knows what changed before anyone opens a dashboard.
Enterprise Context Layer: Connects structured and unstructured data with business context, keeping insights accurate, explainable, and usable.
Enterprise‑grade governance: Supports row and column‑level security, adds HIPAA compliance, integrates with SSO/SCIM, and adheres to enterprise data access standards.
Embed and integrate: Offers SDKs and APIs so insights can be embedded into workflows or applications, not just standalone dashboards.
Pros
Anyone on the team can get answers in plain English, without SQL or modeling.
Answers grounded in your data, not hallucinated by an LLM.
Combines structured and unstructured data for richer insights.
Cons
Requires a direct sales conversation to understand the pricing structure.
2. Sigma Computing
Sigma provides a spreadsheet-like interface for analyzing and visualizing your data. You can use formulas, filters, and pivots the way you already know from Excel. The difference is that Sigma runs on live data from your warehouse, so there's no row limit and no files to refresh.
But when you need customizable dashboards, deeper AI capabilities, or real-time collaboration at scale, Sigma starts to feel limiting. For those, Tableau, Power BI, or WisdomAI are better picks.
Key Features
Predictive analytics and ML: Built-in models for deeper analysis.
Real-time collaboration: Multiple users editing the same workbook at once.
Spreadsheet UI: Analyze your data in a familiar interface.
Pixel-perfect reports: Reusable report templates with input controls for different scenarios.
Pros
Approachable for anyone already comfortable in Excel.
Scalable from small teams to enterprises.
Real-time collaboration features.
Cons
Limited customization options for visualizing data
Advanced data visualization features can be difficult to learn
Access to advanced features requires high-level licensing
3. Domo
If your data is scattered across SaaS apps, spreadsheets, and warehouses, Domo can pull it together in one place and make it dashboard-ready fast.
Here's what to watch for: there's a lot to learn, some of the back-end tools feel dated, and usage-based pricing can escalate quickly if you’re not careful.
Key Features
AI-powered automation: Automated reporting and workflow triggers across the stack.
Data integration: Connect to over 1,000 data sources to keep all your data in one place.
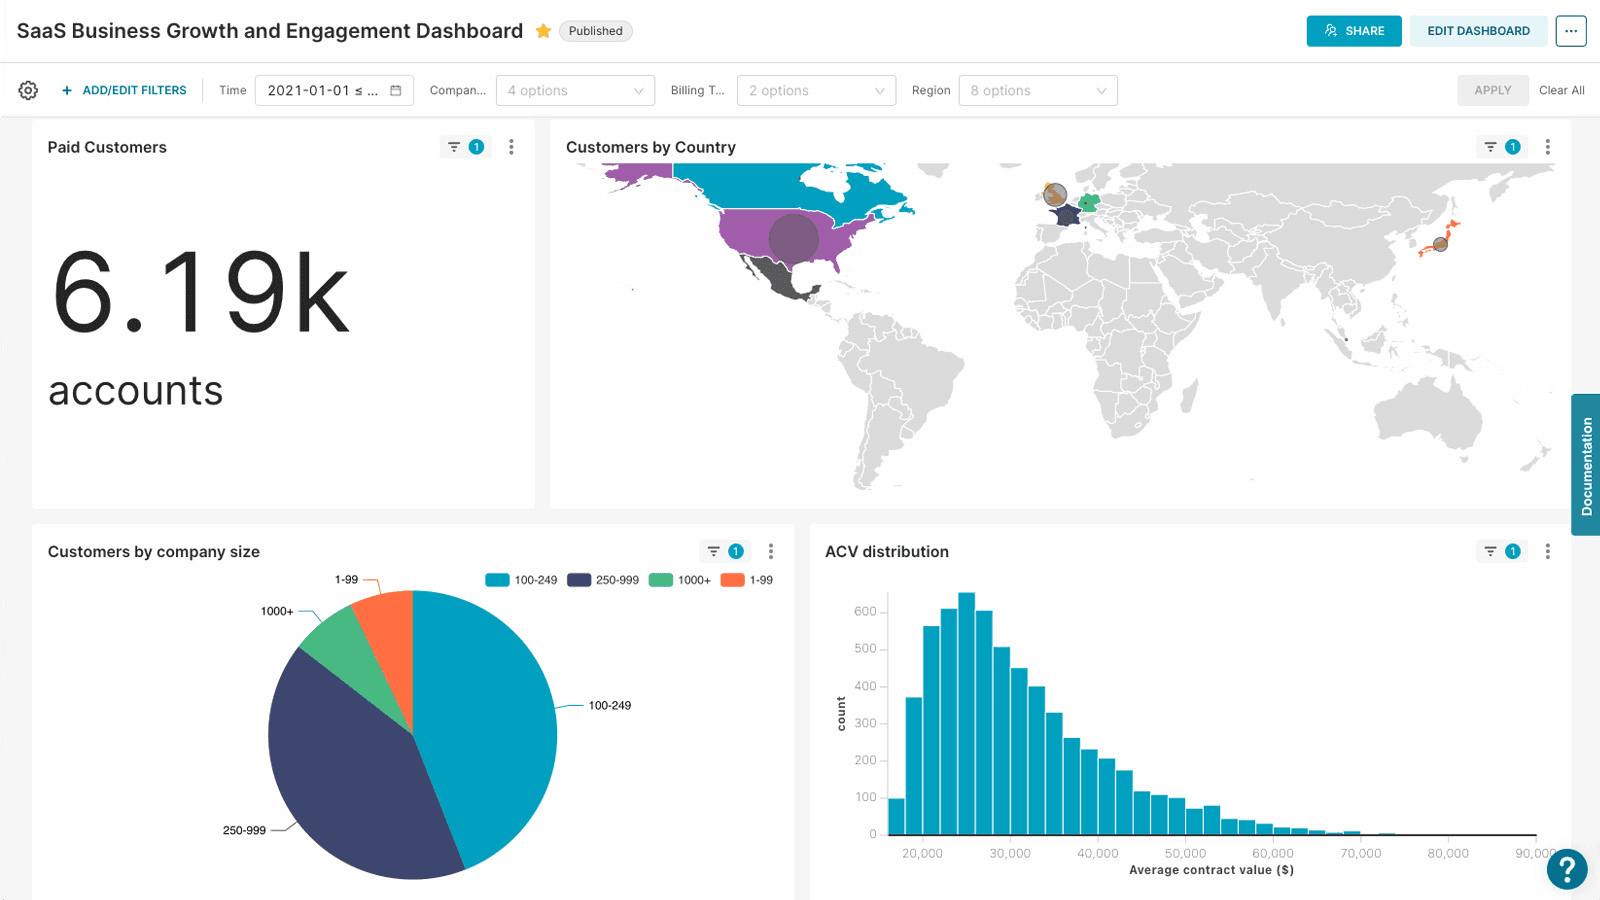
Customizable dashboards: Build tailored dashboards specific to your business’s unique needs.
Advanced security and compliance: SOC 1, SOC 2, HIPAA, and GDPR compliance.
Pros
Easy to adopt for business users.
Real-time reporting and alerting.
Seamless integration with multiple data sources.
Cons
Advanced features take time to learn.
Some of the back-end features feel clunky when doing development work.
Usage-based pricing can climb quickly.
4. Microsoft Power BI
If your team already runs on Microsoft 365, Power BI is the easy choice as it works natively with Teams, SharePoint and Excel.
Like Looker, Power BI still runs on a modeling layer — DAX and Power Query — so the bottleneck for business users doesn't fully go away. But Copilot has made natural-language queries more accessible.
Key Features
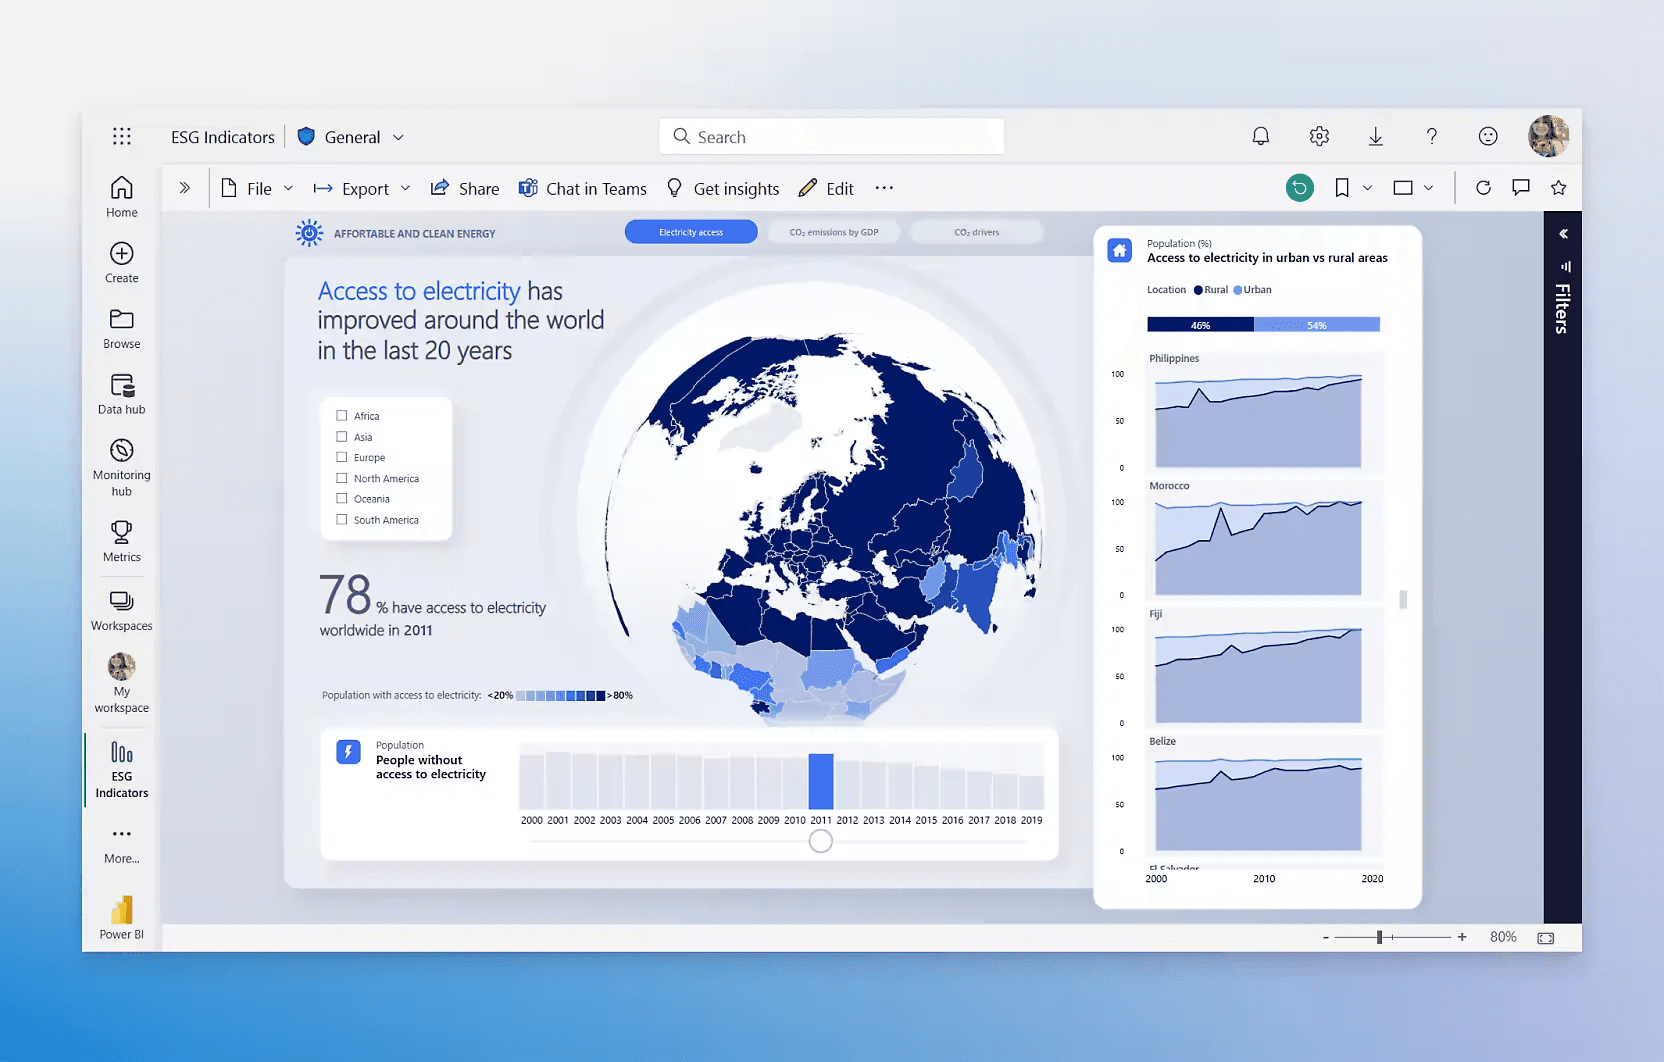
AI Copilot: Great for AI-assisted data exploration.
Customizable dashboards: Drag-and-drop options for building interactive dashboards.
Data modeling: DAX and Power Query for creating custom metrics.
Microsoft 365 integration: Native integration with Teams, SharePoint and Excel.
Pros
Tightly integrated with Microsoft products and services.
Comprehensive data visualization and reporting capabilities.
Affordable pricing for small teams and businesses.
Cons
Steep learning curve for DAX and Power Query.
Limited support for unstructured data.
Performance slows on large datasets and complex models.
5. Apache Superset™
Superset is built for SQL-first teams. While Looker pushes everything through LookML and a modeled data layer, Superset lets analysts query the warehouse directly, visualize the results, and share them, without the need to learn a new modeling language.
On the flip side, you have to manage the ownership. This setup works if you've got engineers who can troubleshoot without vendor support. For everyone else, it can be a risk.
Key Features
Custom visualizations: Broad chart library, including geospatial.
SQL and Drag-and-Drop Interface: Easy to use for non-technical users with drag-and-drop tools, while also supporting custom SQL queries.
Modern data stack integration: Works with Snowflake, BigQuery, Trino, Redshift, and other cloud databases.
Custom dashboards: Dashboards with exploratory features such as cross-filters, drill-down, and tags.
Scalable architecture: Lightweight design that integrates with existing data infrastructure.
Pros
No licensing costs or vendor lock-in.
SQL support and flexible querying.
Broad database connectivity.
Cons
Requires SQL fluency to get real value.
Thinner data modeling than enterprise BI tools.
Limited support for advanced visualizations.
6. Metabase
Metabase gives you two paths. You can run the free version yourself, or pay for the cloud version and get vendor support, AI features, and enterprise controls. Either way, your team can connect to a database and start building charts without SQL.
It fits smaller teams and simpler reporting. But once your data models become complex or your dashboards need to scale, you’ll need additional modeling tools, which will increase costs.
Key features
Metabot AI: Natural-language queries, SQL generation, and chart summaries.
Drill-through dashboards: Explore data without writing new queries.
Visual and SQL querying: No-code builder and full SQL editor in one tool.
Flexible deployment: Cloud-hosted or self-hosted.
Pros
Faster set-up and deployment.
Accessible to non-technical teammates.
Active community with documentation and support threads.
Cons
AI and advanced analytics features like predictive analytics are limited.
Design and customization controls are limited.
Several higher-value features are tied to paid tiers.
7. Tableau
Looker is built for keeping data consistent across a company. Tableau is built for making dashboards that look great. If LookML has been slowing your team down, Tableau gives you more flexibility, but you'll lose some of the consistency Looker enforces. Tableau is still the best tool for building polished dashboards. If your team creates reports for executives or clients, or anywhere visual quality matters, Tableau is hard to beat.
Dive deeper: Find a full Looker vs Tableau breakdown here.
Key Features
Drag-and-drop interface: Build charts, maps, and dashboards with minimal code.
Tableau Pulse and Copilot: AI-assisted exploration, automated insights, and natural-language Q&A.
Advanced visual analytics: One of the broadest chart libraries in BI.
Real-time data updates: Live connections and interactive dashboards.
Pros
Works well in mixed data environments.
Rich visual customization with colors, fonts, layouts, and interactions controllable at a granular level.
Good community support.
Cons
Licensing costs add up quickly as your teams start modeling complex data.
No native semantic layer. You have to add data Management tools, which raise costs.
Metric consistency across dashboards is hard to enforce.
8. Holistics
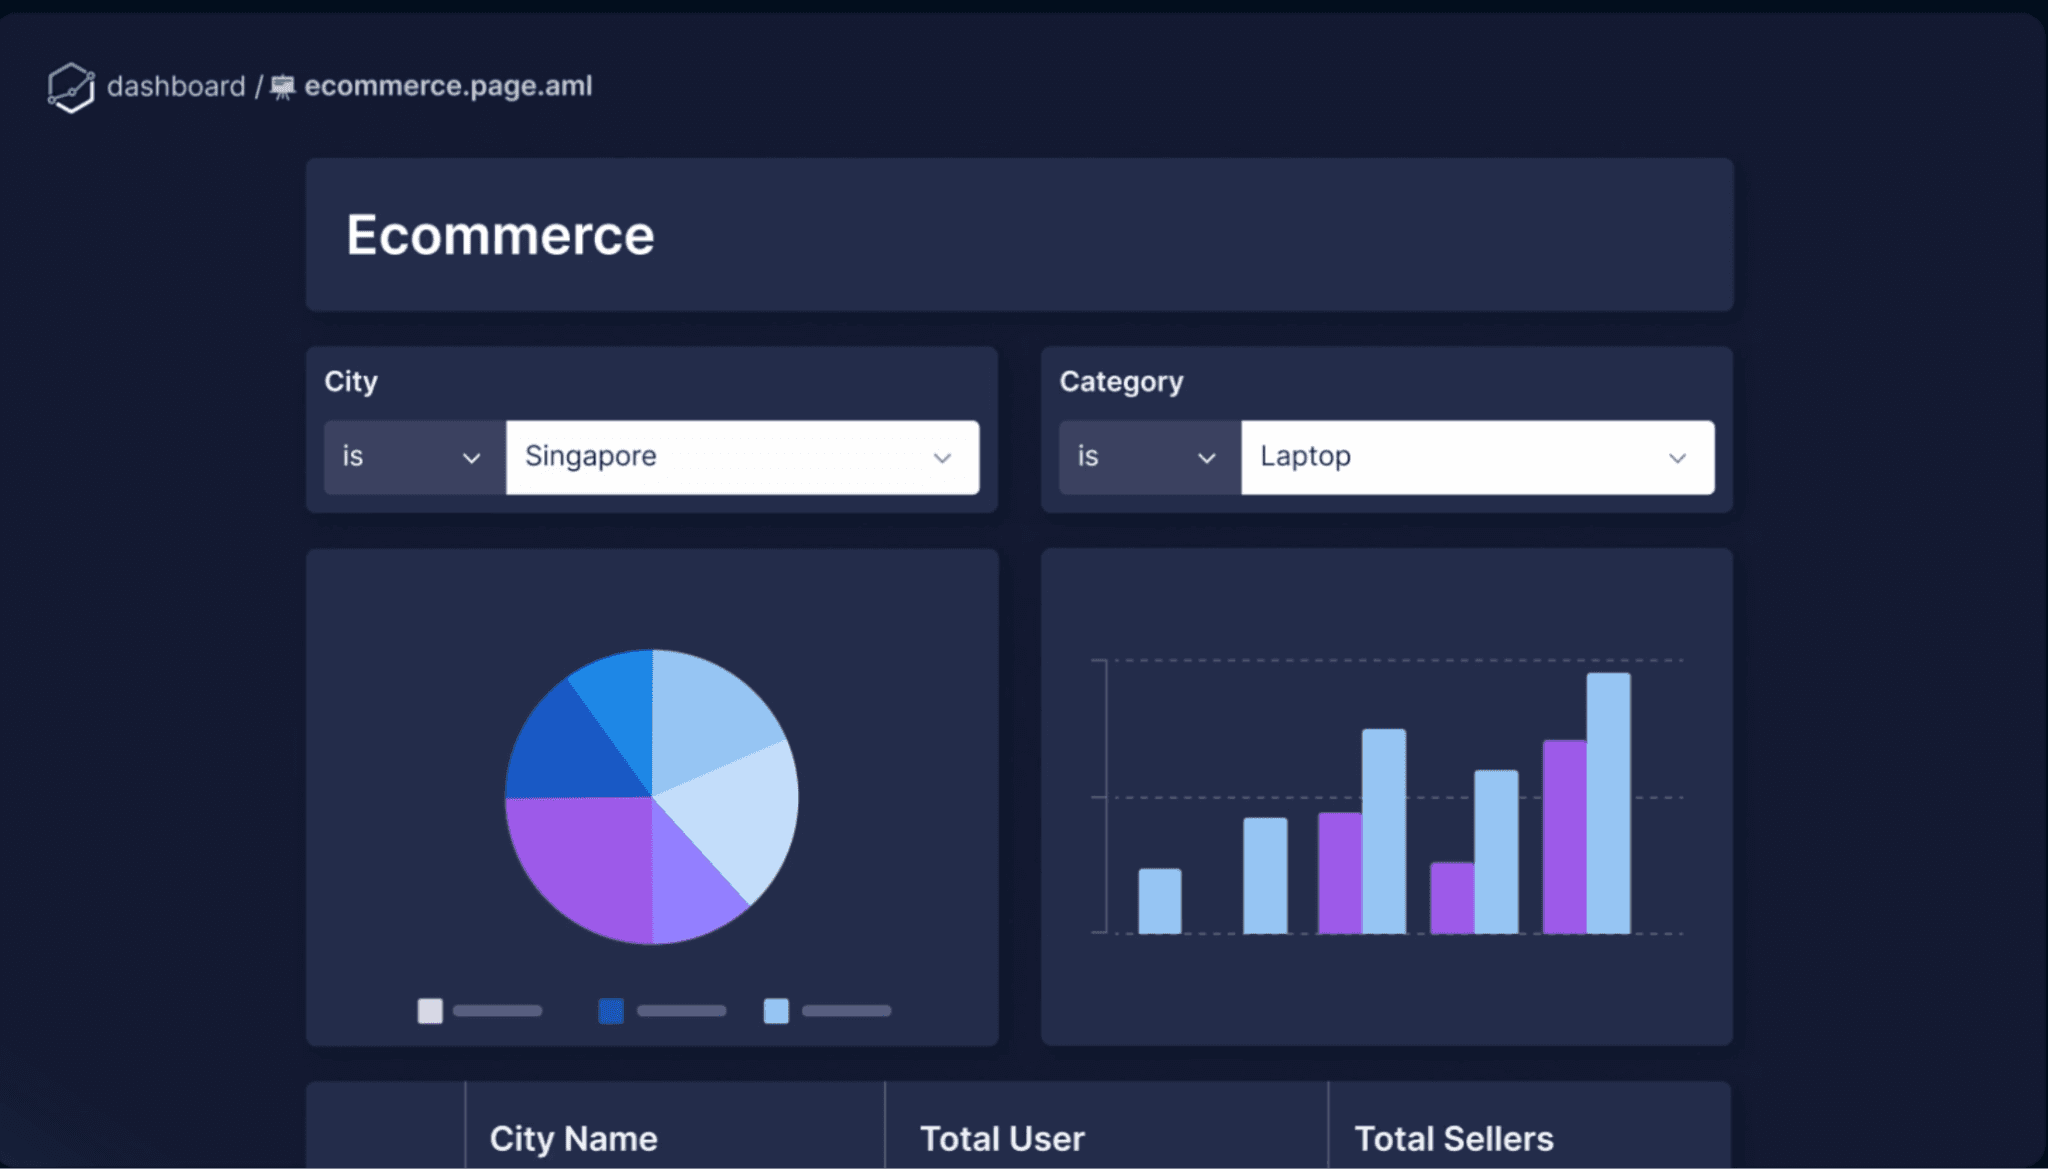
Holistics is the code-first Looker alternative. It uses a semantic modeling layer like LookML, but its modeling language (AML) is open and Git-compatible, not proprietary. It also integrates natively with dbt, which makes it a strong fit for analytics engineering teams already using the modern data stack.
If your reason for leaving Looker is specifically the proprietary modeling language, Holistics is probably the closest match on this list.
Key Features
Semantic modeling layer: Centralized logic for reusable metrics and consistent reporting.
Analytics as code: Git version control and code reviews for better collaboration.
Self-service dashboards: Drag-and-drop features and pre-built datasets.
dbt Integration: Integrates with dbt for better data documentation and version control.
Pros
LookML-style discipline without the proprietary lock-in.
Strong fit for analytics engineering teams using dbt.
Git version control brings software engineering practices to analytics.
Cons
Steep learning curve for setting up data models.
Missing some advanced features (role-playing dimensions).
Performance can lag on Snowflake integrations.
Free your team from the dashboard queue
Here's the real problem with Looker: data teams spend months stitching together connectors, warehouses, and BI tools, only to build dashboards nobody actually uses. People just end up asking the data person anyway.
So, the Looker alternative you should ideally pick is the one that removes that bottleneck.
That’s where WisdomAI wins. Conversational and proactive agents that answer questions in plain English, across structured and unstructured data, without a modeling layer as the starting point. Your team stops waiting on the data person and actually starts making decisions.
Build a BI stack that your team will actually use. Book a demo today.