Guide
8 Sigma Computing alternatives for stronger AI and governance in 2026
When it launched, Sigma Computing was a game changer for finance and ops teams. Instead of exporting data into Excel and pasting numbers back into a dashboard, teams could plan, forecast, and analyze data in the same tool.
For teams who primarily perform analytics in spreadsheet-like interfaces, Sigma may be a great tool for you. However, if your team needs deeper analytics, governed reporting at scale, or advanced AI, Sigma's spreadsheet foundation starts to feel limited. And with so many teams looking for opportunities to incorporate AI into their analytics workflow, it’s a great time to become familiar with other tools on the market.
How to tell if Sigma Computing is right for your team
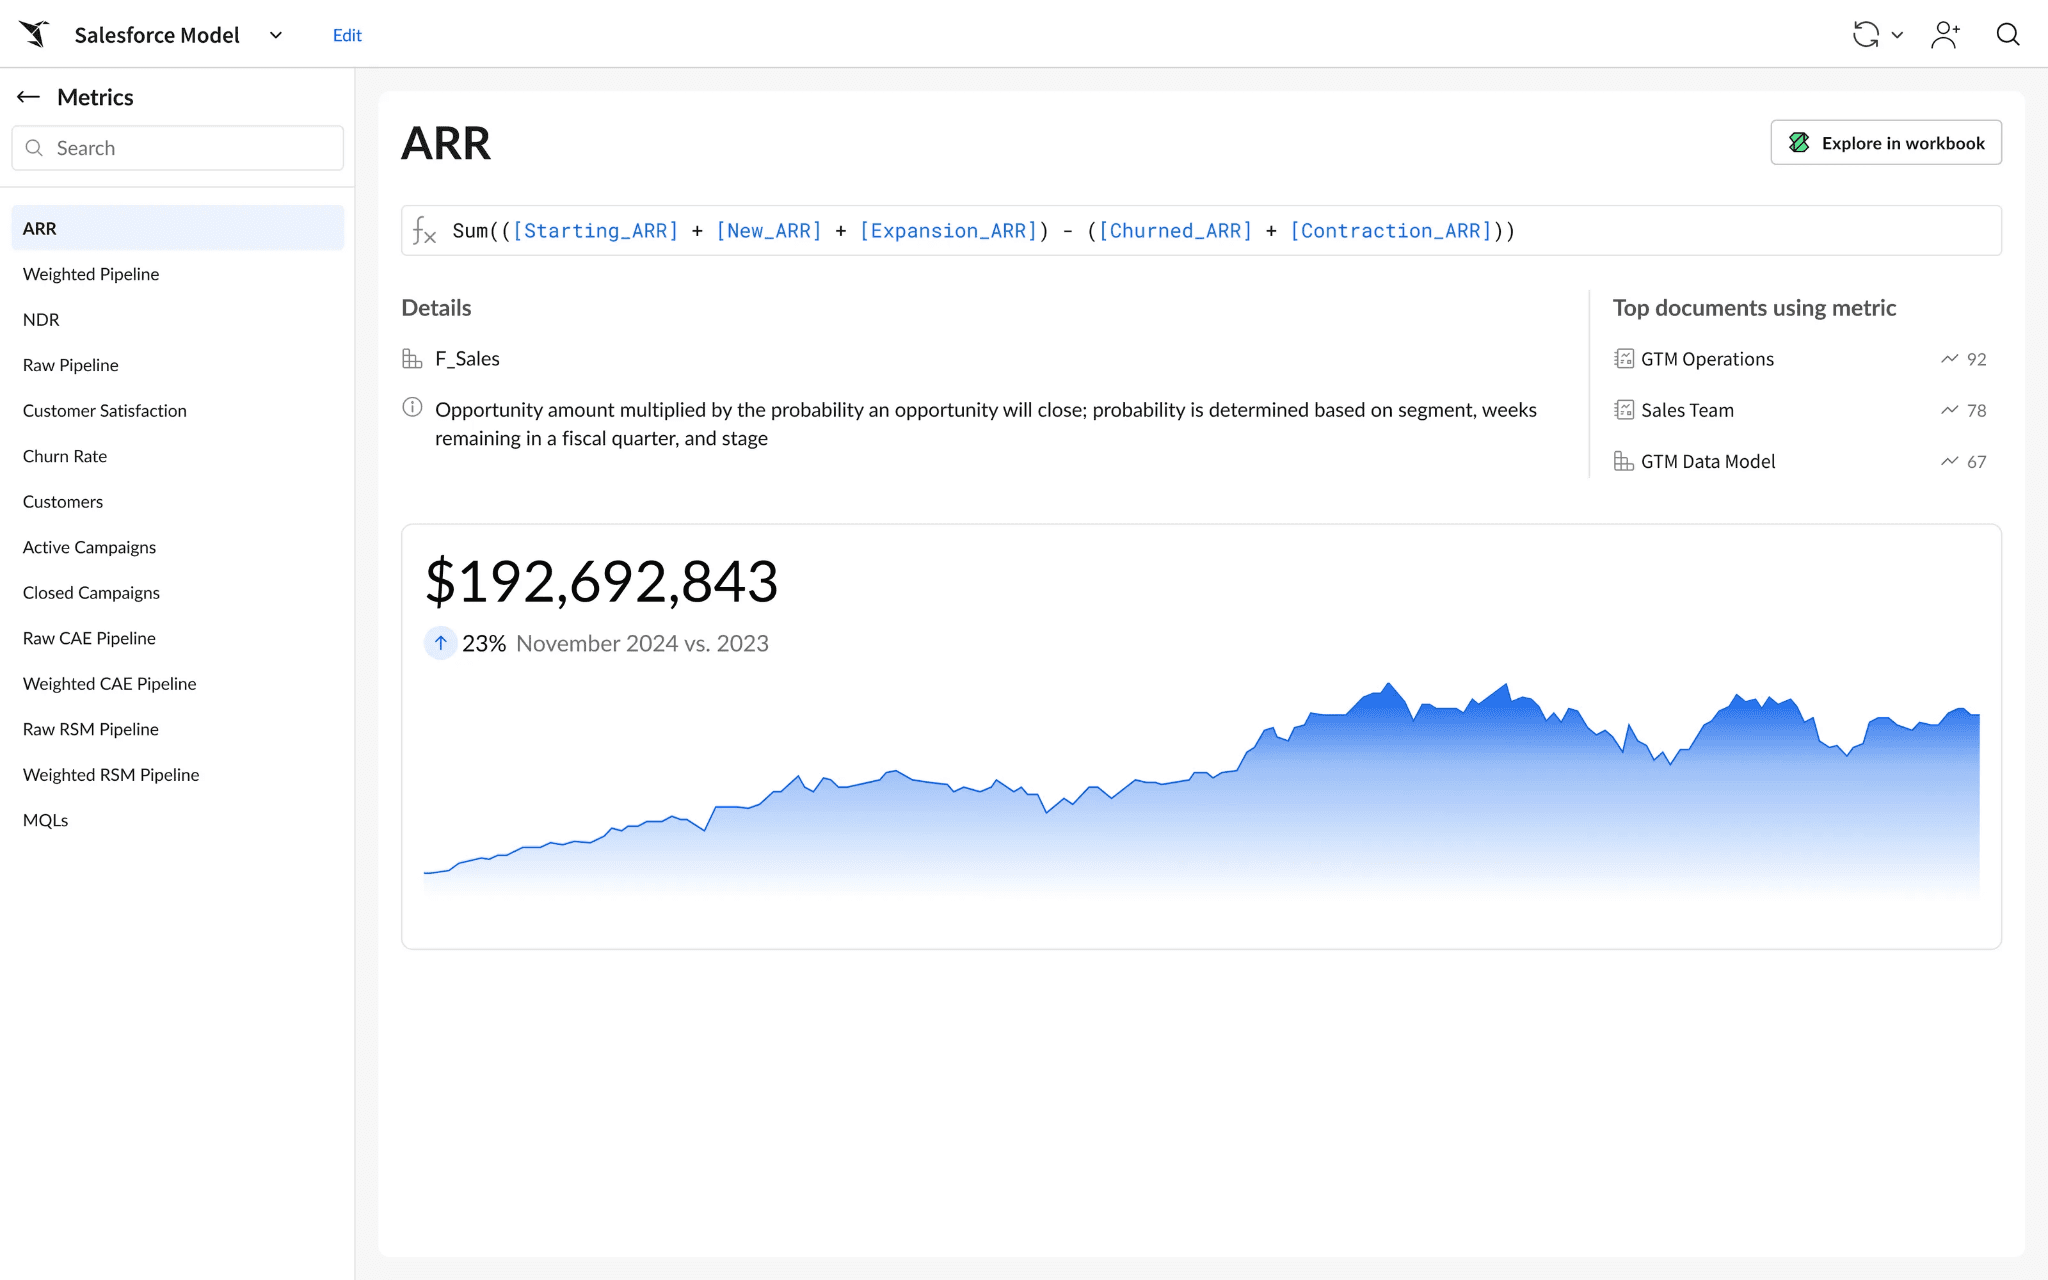
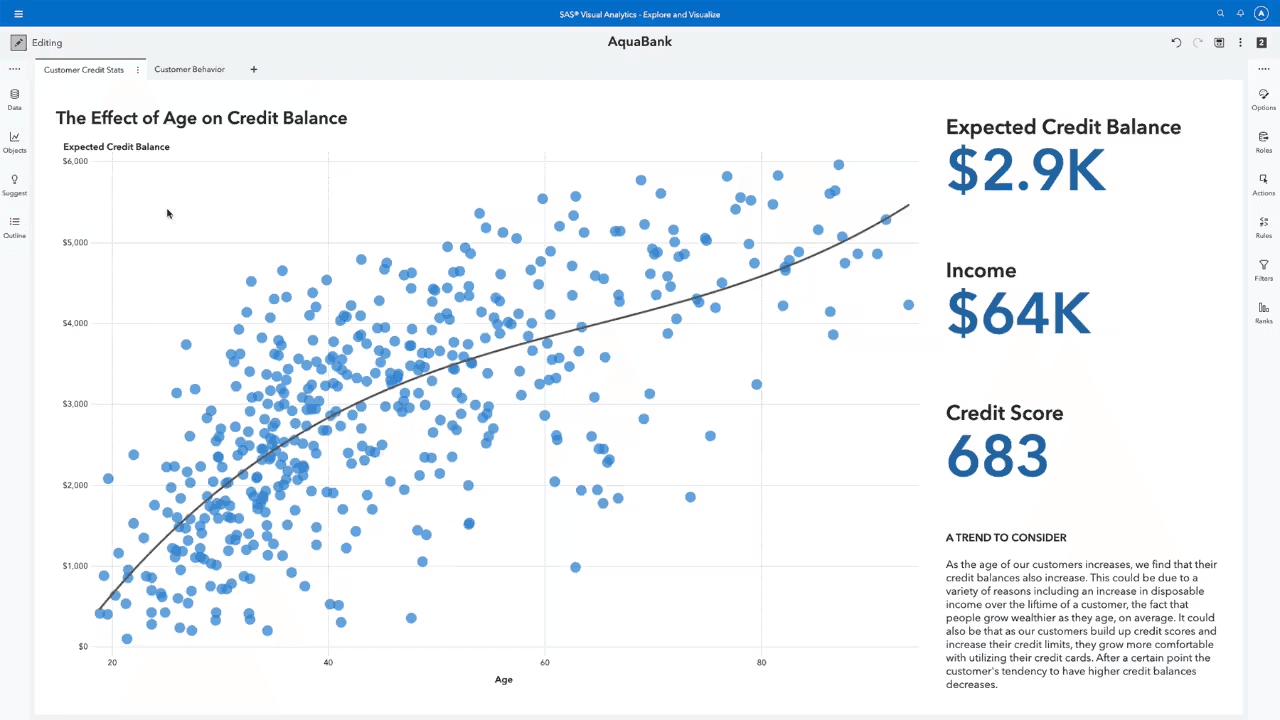
Sigma is a cloud-native BI platform built around a spreadsheet-style interface on warehouse data. For the exploration-and-visualization use case, it's one of the stronger tools on the market. Deciding whether it's the right choice for your team comes down to two questions:
How much advanced analytics does your team do?
Sigma supports Python and SQL, but it isn't a substitute for a data science notebook. The moment your work involves statistical modeling, experimentation, or ML workflows, Sigma will struggle to keep up.
How central is AI to what you want from BI?
Sigma Agents and related features help users move faster inside the spreadsheet paradigm. But they're layered on top of Sigma's foundation rather than built into it. So if you’re looking for something that feels genuinely AI-native, Sigma will likely feel a step behind newer tools in the space.
If one or both matter, you'll find better Sigma alternatives in the rest of this guide, and you can find a complete BI tools comparison here. But before we get into those, here’s a brief recap:
What Sigma does well
Spreadsheet-native analysis on live warehouse data: Familiar formulas, filters, and pivots running directly against your warehouse, with no exports or extracts.
Self-service access: Business users and analysts work in the same tool, with both a spreadsheet UI and SQL support for deeper work.
Write-back and data apps: Update source data from inside a report and trigger downstream workflows.
Real-time, live data: Direct warehouse queries mean no manual refreshes.
Where Sigma falls short
Performance issues: Reviewers on G2 consistently report slow load times when filters are applied to heavy reports.
Version and permissions management: Managing document versions and user permissions is challenging.
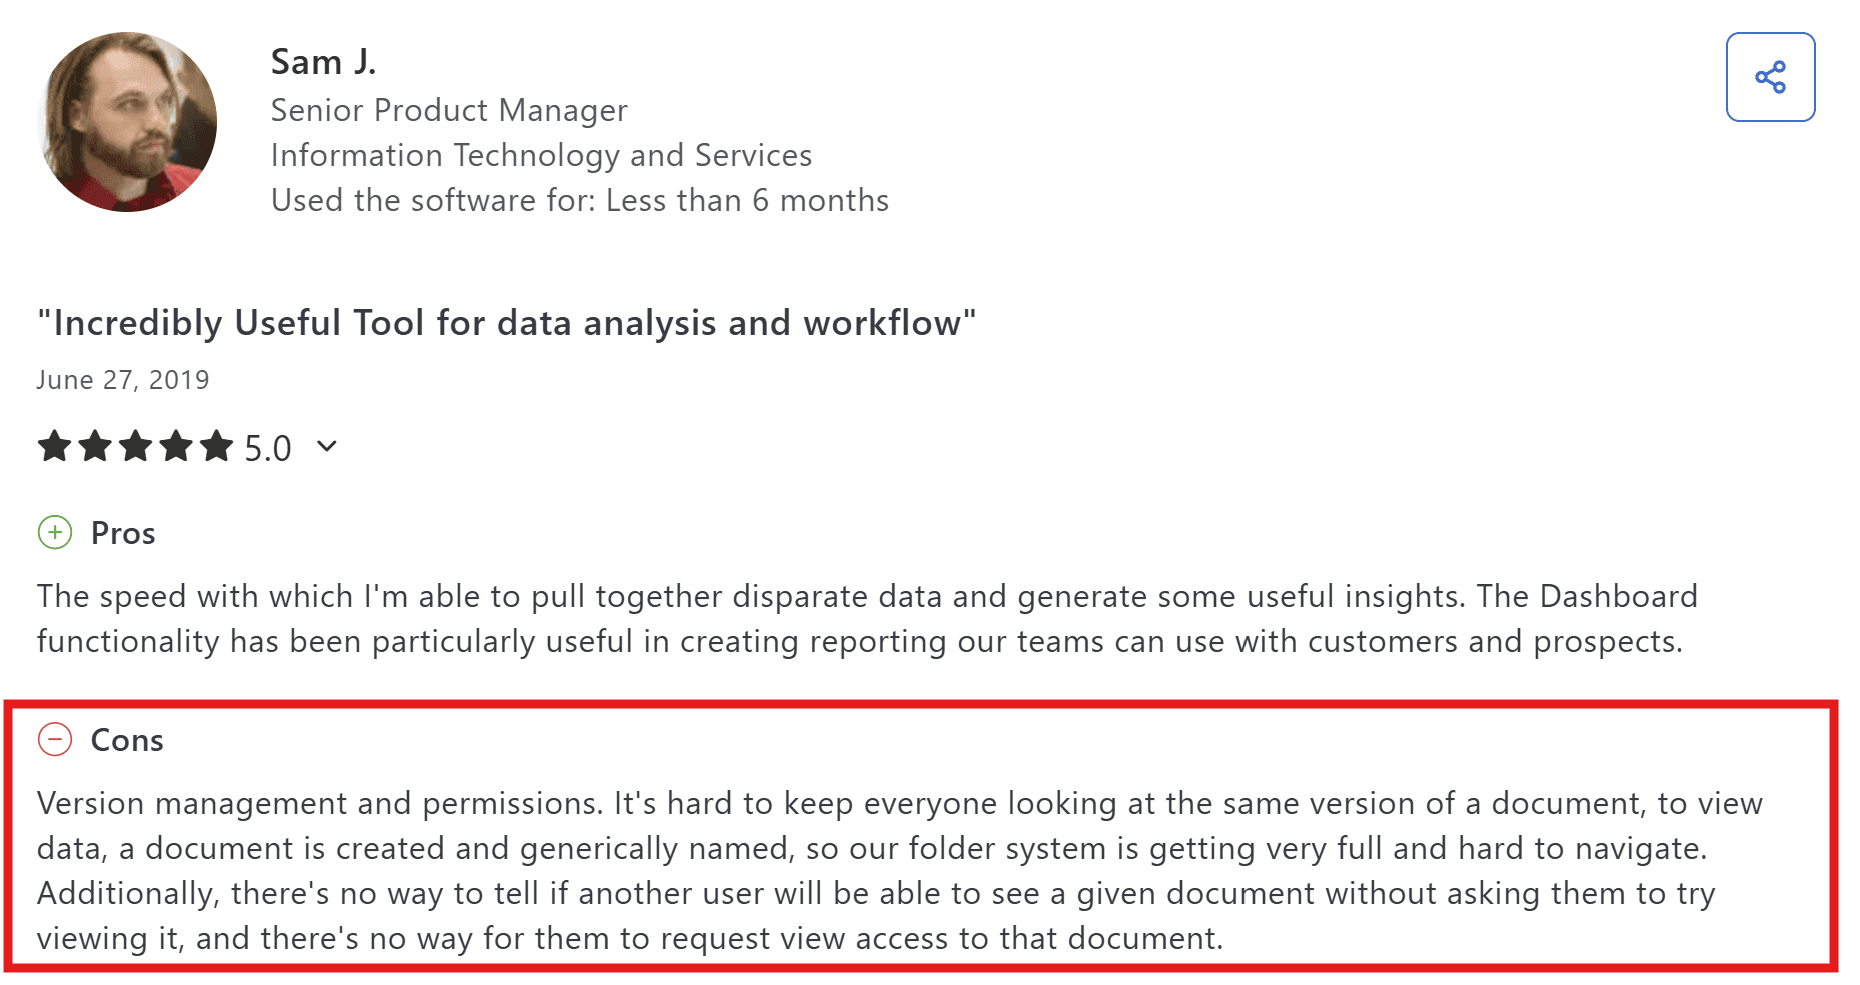
Source: Capterra
Complex dashboard creation: Building dashboards for large datasets may require extensive workarounds.
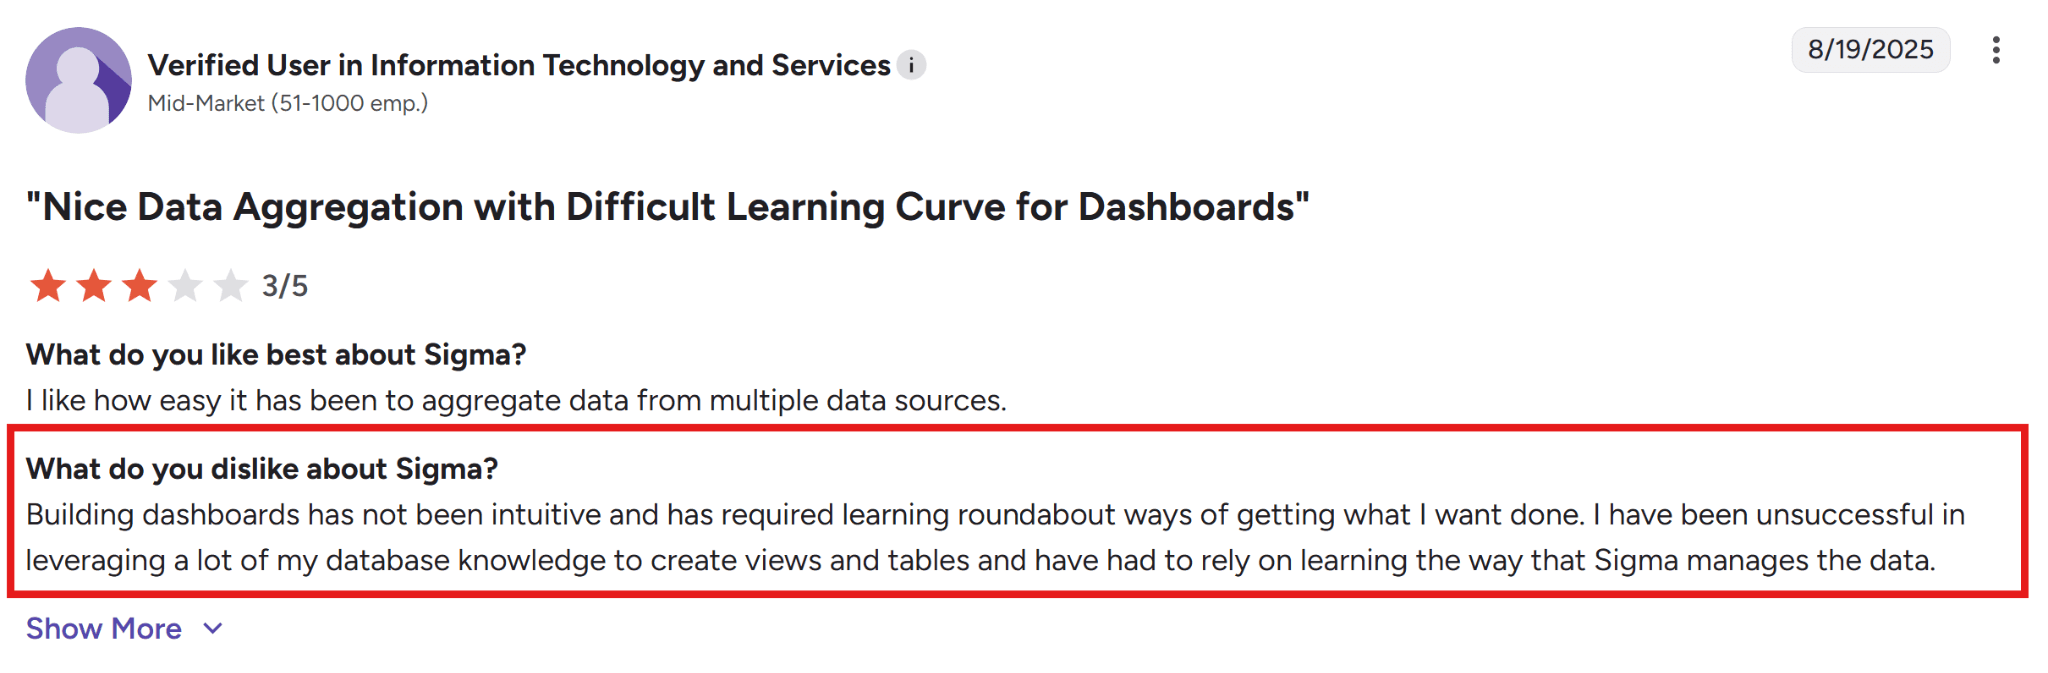
Source: G2
Comparing Sigma Computing alternatives
Tool | Outstanding Features | AI and Automation | Pricing | Best For |
WisdomAI | Unified semantic layer, connects structured + unstructured data, proactive agent alerts | Full AI automation with proactive agents | Custom pricing based on specific needs | Teams needing trusted analytics with conversational BI, proactive agents, and enterprise context. |
IBM Cognos Analytics | Enterprise reporting, broad visualization library, mobile access | Automated forecasting and predictive analytics | From $11.25 per user/month | Enterprises needing governed reporting at scale. |
SAS Viya | Statistical modeling, ML workflows, and operational decisioning tools | Pre-built AI models | Custom pricing | Data science teams building and deploying predictive models |
Phocas Analytics | Self-service reporting for finance, sales, and operations | AI-assisted insights | Custom pricing | Finance and ops teams who want pre-built dashboards. |
GoodData | Embedded analytics, composable APIs, and multi-tenant support | Conversational AI and smart search | Custom pricing | SaaS companies shipping dashboards inside their own product to their customers. |
Amazon QuickSight | Native AWS integration, low entry price, and serverless architecture | AI-assisted insights | From $24 per user/month (Author) | Teams that already rely on AWS and do not want another vendor. |
Looker | LookML semantic modeling, governed metric definitions, and BigQuery integration | Gemini for AI-assisted modeling and exploration | Custom pricing | BigQuery-heavy teams with analysts fluent in SQL and ready to learn LookML |
SAP Analytics Cloud (SAP) | Planning and forecasting in one tool, native SAP integration, and predictive scenarios | Joule for AI-assisted insights and modeling | Custom pricing | SAP-heavy enterprises running finance planning, forecasting, and reporting in one tool |
Here's the deeper look at each tool:
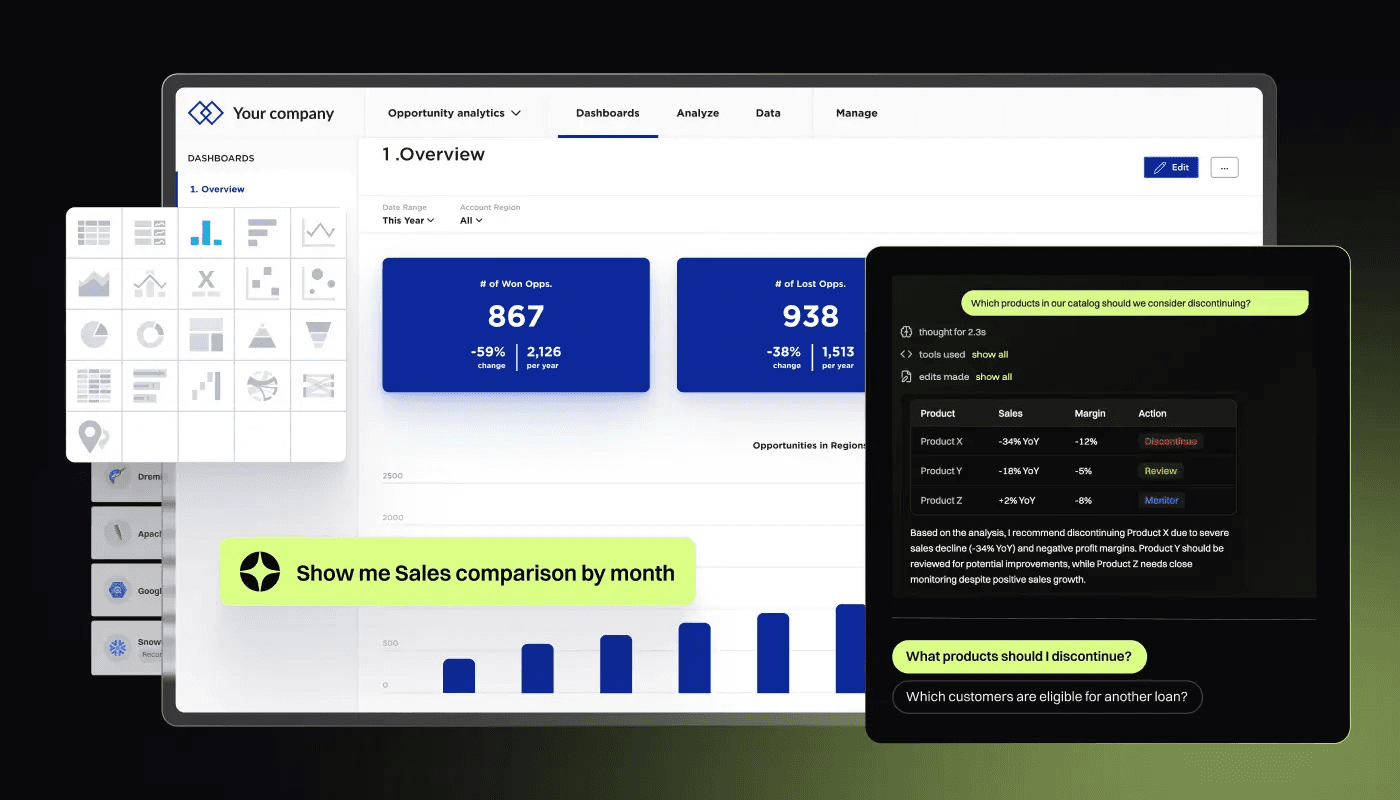
1. WisdomAI: Best overall
While Sigma relies heavily on spreadsheets and SQL interfaces for exploration, we’ve built WisdomAI to help both analysts and business users interact with data conversationally and surface insights proactively.
WisdomAI brings together natural-language queries, cross-source reasoning, proactive agents, and AI-powered dashboards, all built on top of an enterprise context layer. That layer holds your business definitions, metric logic, and metadata, so the answers you get are actually about how your company works.
Key Features
Conversational BI: Ask questions in plain English and get accurate answers without writing SQL.
Proactive Insights Agent: Monitors data, flags anomalies, and delivers recommendations before issues crop up.
Enterprise Context Layer: Stores business definitions, logic, and metadata to keep AI answers accurate and traceable.
Cross-source intelligence: Connects information across systems to create a usable business context for analysis.
Embed and integrate: SDKs and APIs deliver insights directly into your team's workflows.
Pros
Business users get answers without having to analyze themselves.
Answers stay grounded in your business context.
Supports both structured and unstructured data.
AI-driven platform without reliance on legacy BI tools.
Cons
Pricing requires contacting sales.
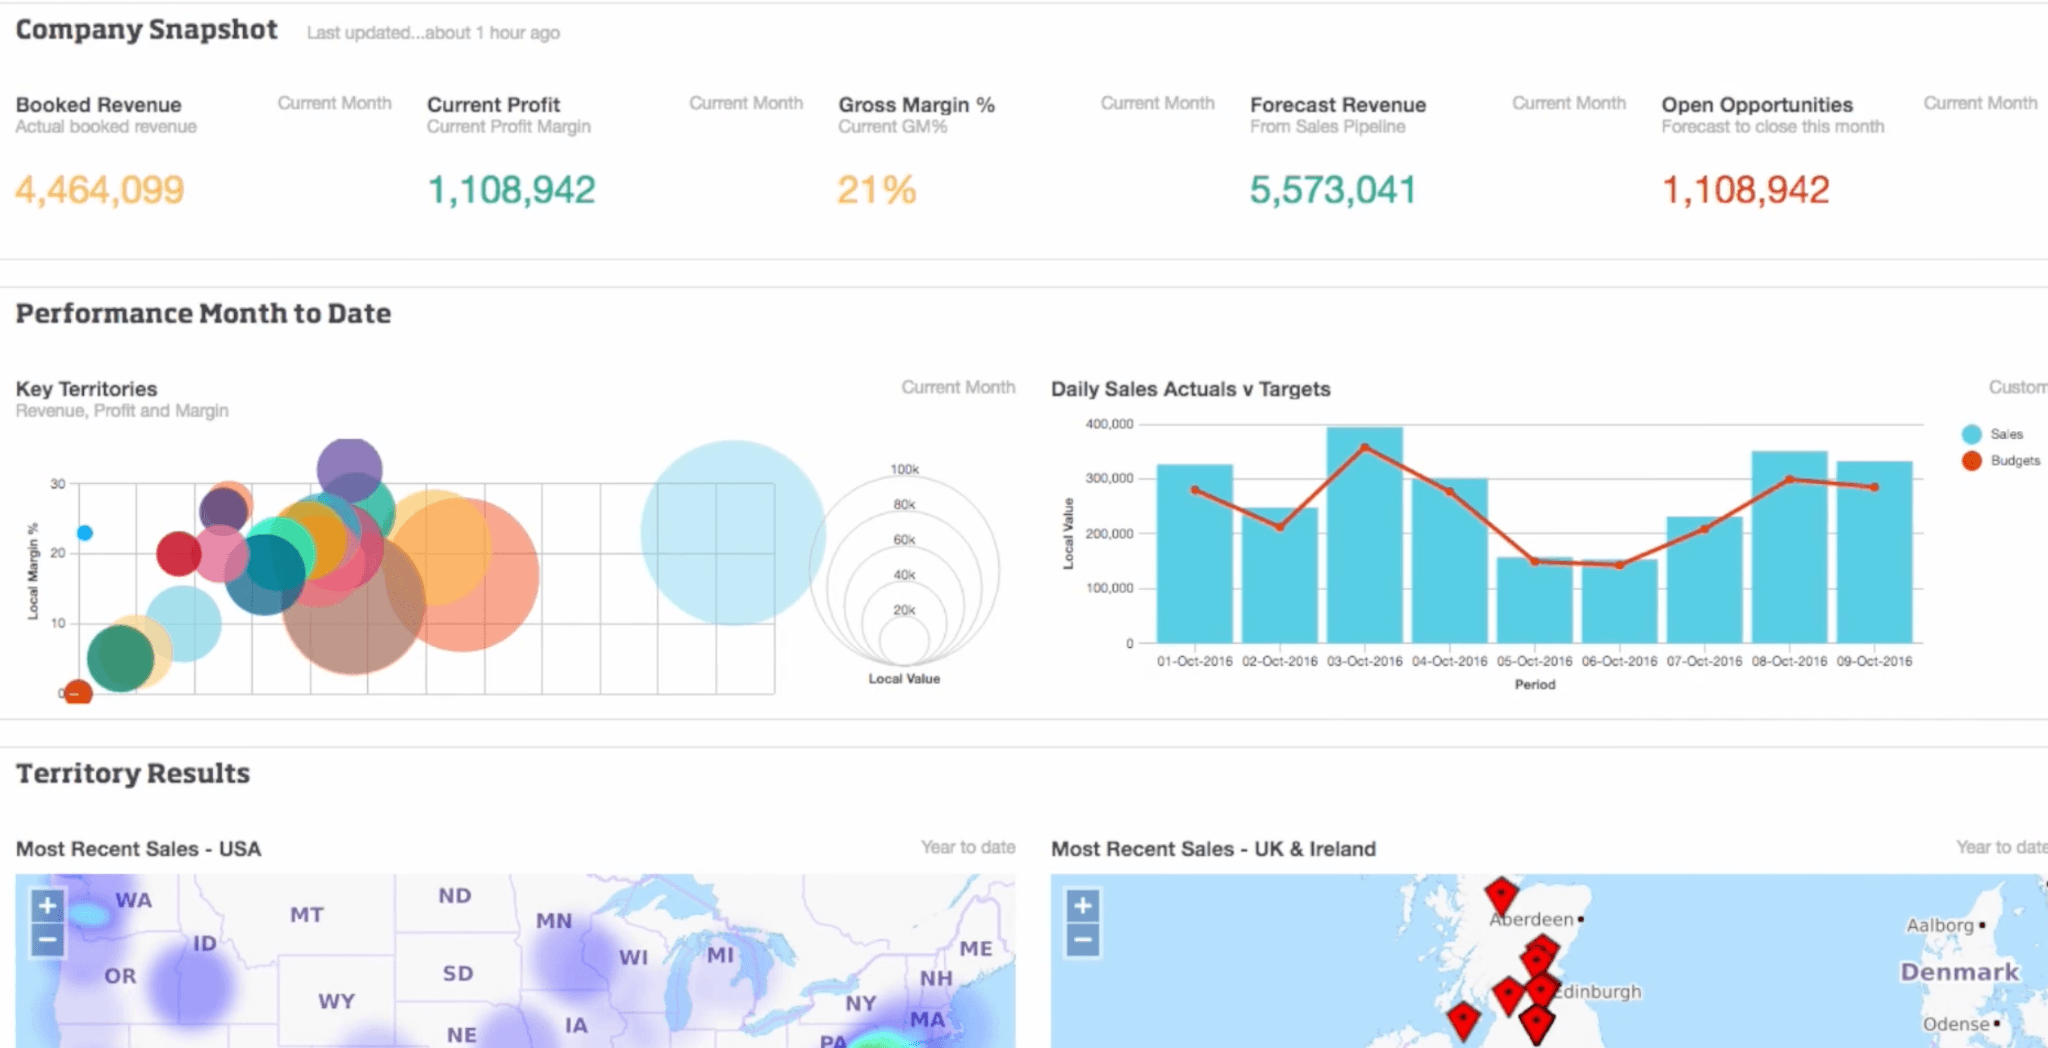
2. IBM Cognos Analytics: Great for standardized IT reporting
Cognos is a long-established enterprise BI platform from IBM, built around governed reporting and a broad visualization library. Where Sigma is designed for business users to explore data independently, Cognos is typically deployed by IT teams to standardize reporting across the organization.
It's the stronger pick when you need a single source of truth for thousands of users, or when your reports need to meet audit and compliance standards.
Key Features
Forecasting and predictive analytics: Supports advanced analytics like modeling and scenarios.
Real-time reporting: Dashboards refresh with data changes.
Broad visualization library: Offers a range of pre-built data visuals.
Cloud and on-prem integration. Connects to both deployment environments through a centralized data access layer.
Governance and access controls: Uses roles, audit logs, and permissions for compliance.
Pros
Forecasting and predictive analytics are built in.
Paginated reporting and data integration capabilities.
Accessible to both technical and non-technical users, once past the learning curve.
Cons
Slow performance with large datasets and complex reports.
Visualization and self-service capabilities are often described as lagging behind competitors like Tableau or Power BI.
Advanced features typically require technical training to use effectively.
3. SAS Viya: Top for data science teams
SAS Viya is a cloud-native data platform built for data science teams that need to push statistical modeling, machine learning, and ModelOps workflows into production. The contrast in the market is clear: while Sigma caters to business users looking for spreadsheet-style exploration, Viya targets data scientists operating at enterprise scale.
If your team is focused on training and deploying machine learning models rather than just assembling dashboards, Viya fits the bill.
Key Features
Predictive modeling: Capabilities geared toward machine learning and advanced statistics.
Hybrid architecture: Operates across multi-cloud and on-prem environments.
Matrix programming: Understand complex relationships in data using exploratory data analysis.
Open-source integration: Supports Python and R natively.
Real-time monitoring: Tracks key metrics to detect performance drops.
Pros
Scales for large datasets and complex statistical workloads.
Pre-built dashboard templates for faster visualization.
Cloud-native design simplifies deployment.
Cons
Steep learning curve for teams without a coding background.
High cost and complex licensing, especially for smaller orgs.
Overkill for organizations that need BI rather than data science.
4. Phocas Analytics: Good for small teams with no data-team support
Not every team needs a platform built for high-level data analysis. Phocas Analytics serves the teams that just need clear, accessible visuals, offering a streamlined interface that favors usability over complex modeling.
The real differentiator is the infrastructure. While Sigma requires a cloud data warehouse to let you build your own spreadsheet-style reports, Phocas connects directly with your ERP systems and generates custom dashboards. This gives you immediate insights without the need for a heavy IT setup.
Key Features
Pre-built reports for finance and ops: Customizable reports and alerts.
Interactive dashboards: Drill into data for deeper analysis.
Data integration: Connects to common ERP, CRM, and accounting systems.
Budgeting and revenue tracking: Specialized tools to track financials in one place.
Automated syncing: Scheduled updates that keep your data consistent.
Pros
Intuitive interface that works for non-technical teams.
Quick time-to-value for common finance and ops reporting.
Quick set-up and deployment.
Cons
Limited design options; your dashboards will look standard.
Data refreshes run overnight, not in real time.
Troubleshooting can be slow, as there is no live chat or immediate phone helpline.
5. GoodData: Good for developers
For SaaS companies looking to turn analytics into a product feature, GoodData is purpose-built for the job. APIs, SDKs, and multi-tenant architecture make it possible to ship dashboards inside your product without building the infrastructure from the ground up.
That specialization is what separates it from Sigma and most of this guide. While Sigma is built for internal teams to explore their own data, GoodData gives you the infrastructure to white-label and scale analytics for thousands of your own users.
Key Features
Embedded analytics: APIs, SDKs, and white-labelling tools to integrate dashboards into your product.
Multi-tenant architecture: Serve many customers from one deployment.
Composable data mode: Share metric definitions across apps and teams.
Governed data: Uses metadata-only queries for safety and compliance.
Scalability: Scales easily as your SaaS product grows.
Pros
Strong fit for product teams embedding analytics for customers.
Good integration and composability with other apps.
Solid governance model for multi-tenant use cases.
Cons
It’s a "developer-first" tool, meaning you’ll need engineering resources to get it up and running.
Because it’s specialized for embedding, it’s not the best choice for internal company reporting.
Traditional BI features, such as advanced report exports, aren't as robust as standalone tools.
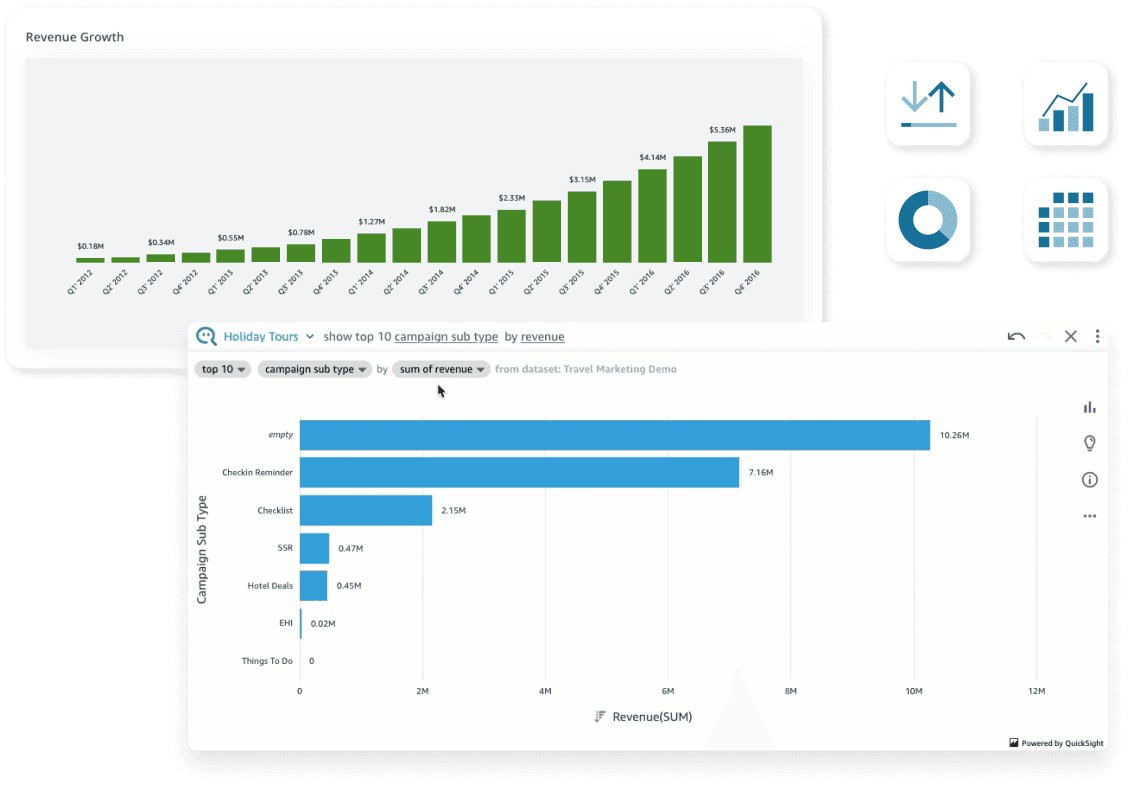
6. Amazon Quick Sight: Good for AWS databases
Quick Sight is essentially a "utility-first" BI tool. It doesn't try to compete with the high-design visuals of Tableau or the spreadsheet-flexibility of Sigma. Instead, it aims to be the most frictionless, cost-effective way to get your data in front of as many people as possible.
If your data resides in the AWS ecosystem, this is easily your path of least resistance. Just keep in mind that this convenience comes with a catch: the interface is notably rigid and often feels like it was built by engineers, for engineers.
Key Features
AWS-native integration: Direct connection to S3, Redshift, Athena, RDS.
Interactive dashboard: Standard BI visualization and exploration options.
Amazon Q assistant: An AI assistant that lets you build visuals and summarize findings
In-built memory engine: Updates your dashboards in real-time, even when you’re working with massive datasets.
Enterprise-grade governance: Built-in role-based access controls and auditing features.
Pros
Tiered pricing keeps costs low for read-only users.
Tight integration with the rest of AWS.
Serverless setup reduces operational overhead.
Cons
Visualization options are fewer than those in Tableau or WisdomAI.
Data modeling can feel restrictive for complex use cases.
Natural-language capabilities require Pro-tier licensing, which narrows the pricing advantage.
7. Looker: Good for Google BigQuery
Google’s Looker is built for teams that want one governed definition of every metric. That governance runs through LookML, Looker's proprietary modeling language.
LookML is powerful but requires analyst capacity to build and maintain, and it takes longer to implement than most tools in this guide. Google has also added Gemini features for tasks like visualization generation, but LookML remains the core of the platform.
Key Features
LookML semantic layer: Governed metric definitions shared across the organization.
BigQuery integration: Native access to Google Cloud's warehouse.
Interactive dashboards: Real-time data exploration through drillable dashboards.
Embedded analytics: APIs and extensions to embed dashboards in custom applications.
Gemini-assisted workflows: Google's AI assistant for data visualization and summary generation.
Pros
Strongly semantic layer.
Deep BigQuery integration for Google Cloud customers.
Scales well for organizations with mature analytics practices.
Cons
Steep learning curve driven by LookML dependency.
An analyst-heavy model, as business users cannot easily build their own data models.
Performance can slow on large datasets.
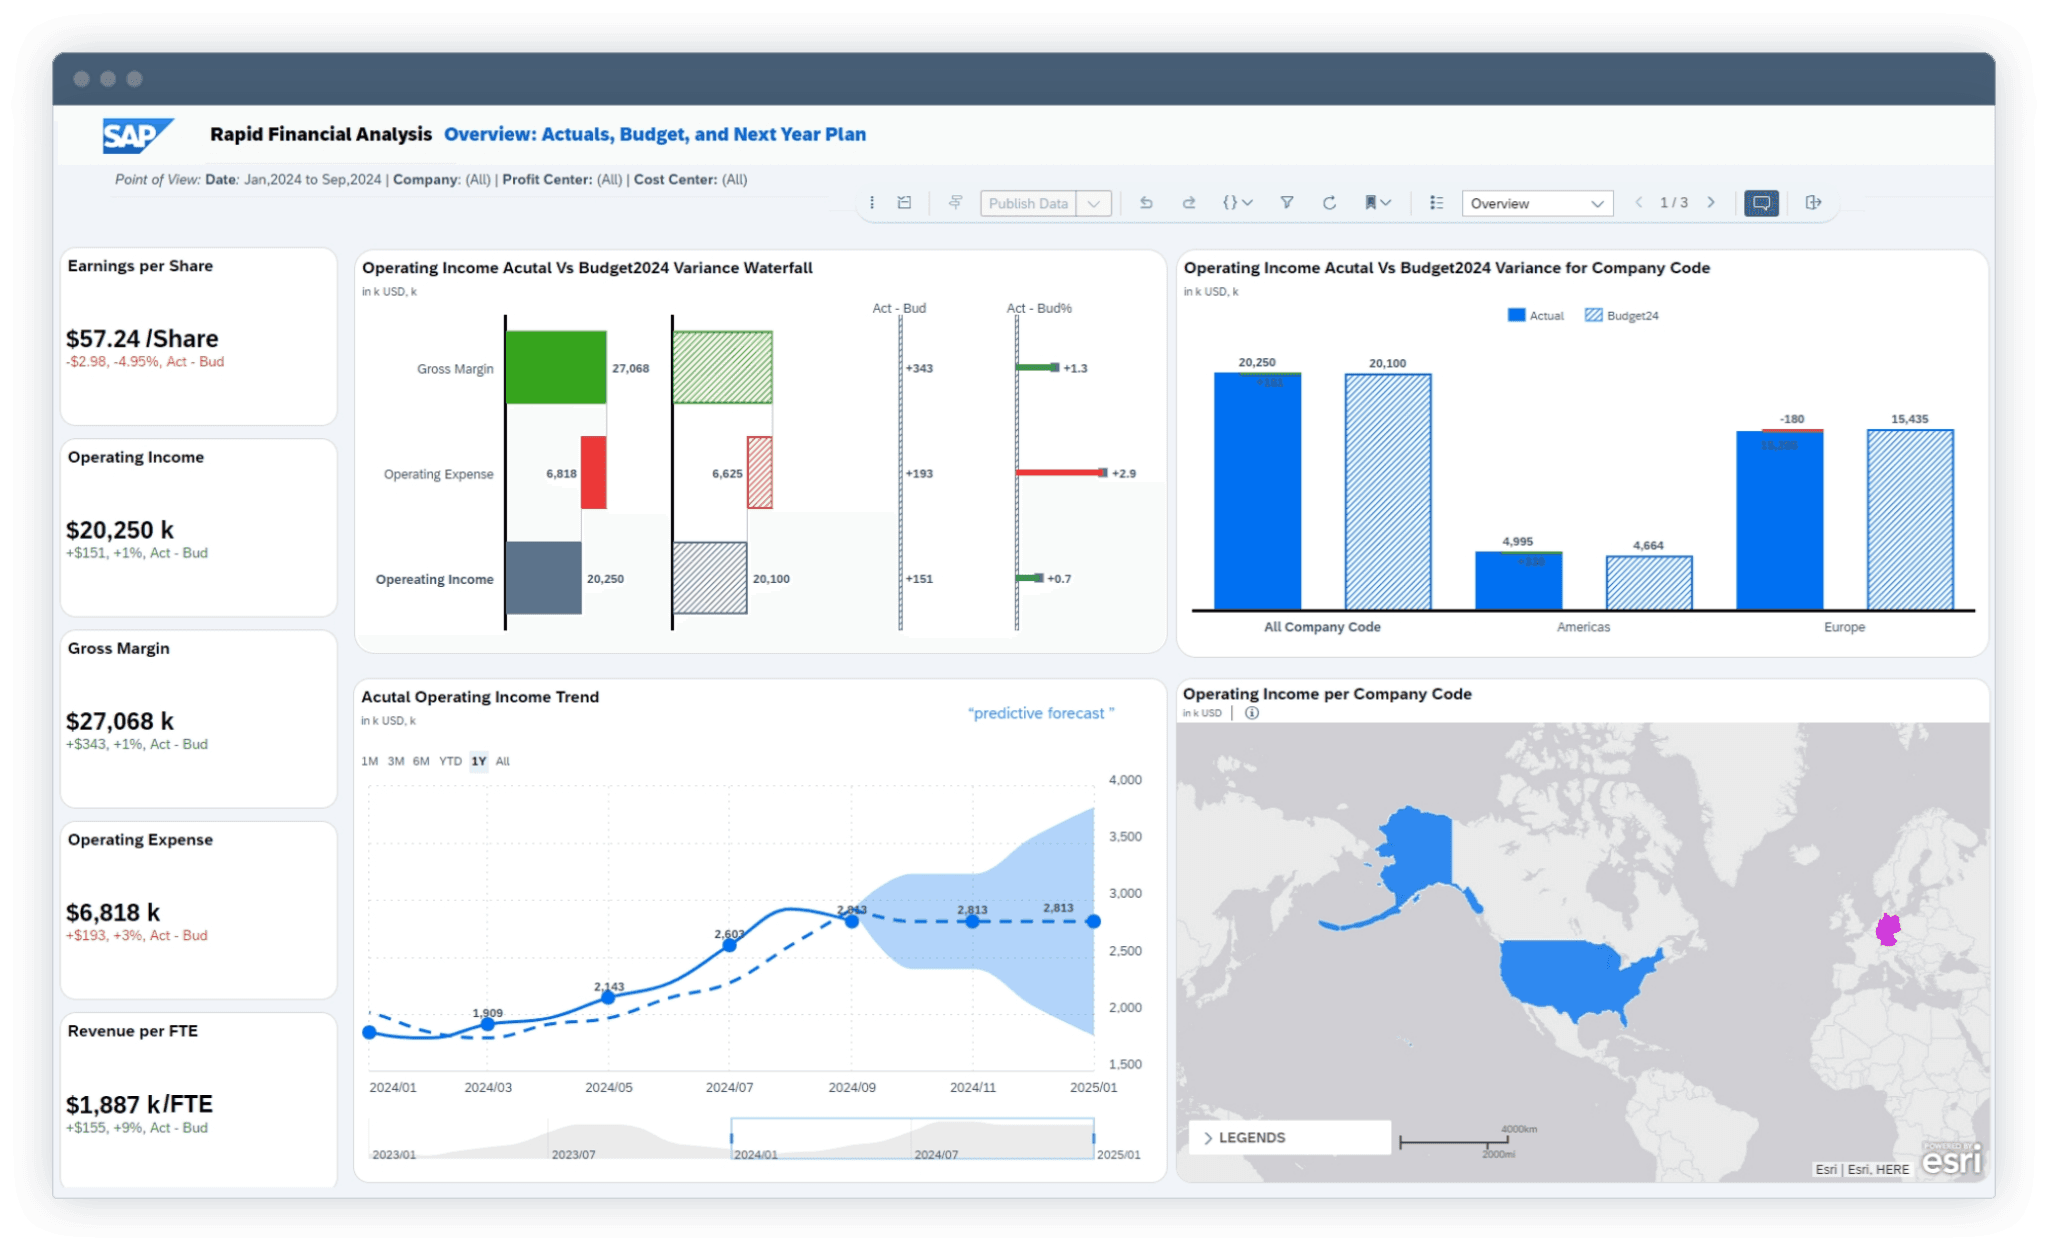
8. SAP Analytics Cloud: Good for SAP users
SAP Analytics Cloud is the natural choice for organizations already running on SAP. It is particularly popular with Finance and Ops teams because it collapses budgeting, forecasting, and reporting into a single environment. You no longer have to juggle separate Excel sheets, legacy planning tools, and disconnected dashboards just to create a forecast; SAC handles the entire cycle in one place.
However, if you want best-in-class ML flexibility or highly customizable data modeling from non-SAP sources, you’ll likely find the experience more restrictive and "engineer-heavy" compared to other Sigma alternatives.
Key Features
Native SAP integration: Connectivity to S/4HANA and the broader SAP stack.
Predictive scenarios: Built-in forecasting and what-if analysis.
Customizable Workflows: Tailor data pipelines and reporting to fit specific business needs.
Real-Time Analytics: Monitor your KPIs to find performance gaps.
Joule assistant: SAP's AI assistant makes data analysis easier
Pros
Strongest fit for finance teams working within SAP environments.
Unified BI and planning reduces handoffs between tools.
Permissions and governance are inherited directly from SAP.
Cons
Licensing costs can escalate quickly, especially during data migration.
The product development lifecycle often feels inconsistent as features are introduced without full coverage.
Live connectors can feel sluggish.
Embrace the agentic analytics experience
If you’re looking for a spreadsheet-like data experience, Sigma may be a great choice for your data analytics. However, if you’re looking to upgrade to a more modern, AI-first platform that enables self-service and cuts down on repetitive tasks for every-day analysis, it’s time to break out of the confines of your rows and cells.
WisdomAI is built to deliver reliable insights through conversational analytics, proactive agents, and enterprise-grade governance. It is the best option for businesses looking to get the most out of their data investments.
Book a demo today and see how you can add some wisdom to your analytics workflow..