
PUBLISHED:
UPDATED:
Qlik positions itself as a self-service analytics platform, but its scripting layer and steep learning curve tell a different story. The moment you want to explore something beyond a pre-built report, you are back to waiting on an analyst. In an era where people are vibe-coding entire apps, slacking someone for a simple dashboard is a bottleneck you shouldn’t even have. This guide breaks down eight Qlik alternatives built to give you actual self-service power.
Qlik’s power rarely makes it past the analyst layer
Qlik’s associative engine is its biggest differentiator. It lets analysts explore complex relationships across their data without writing a single query, surfacing connections that traditional query-based tools would miss. But that depth of access rarely extends beyond the analyst layer.
To do anything beyond viewing a pre-built report, you are forced to learn QlikScript. Adding a data source means writing and maintaining load scripts, and changing a metric definition means tracking down whoever owns the data model. None of this is something you pick up overnight—it requires weeks of specialized training.
As a commenter in a BI forum put it: “I have honestly never seen any end user say Qlik is the easiest to use. Qlik is the best for BI developers.” This reputation has followed the platform for years, and it still hasn’t changed.
The result is a familiar bottleneck: analysts spend their time fielding report requests instead of doing real analysis, while you wait days for answers that you needed yesterday.
Why do teams look for Qlik alternatives?
Business users can’t self-serve: Qlik’s data model requires scripting, which means you can only explore data your analyst has already modeled. Although the platform has added AI capabilities for natural-language querying, reviewers say the feature is limited in scope and doesn’t fully close the gap.
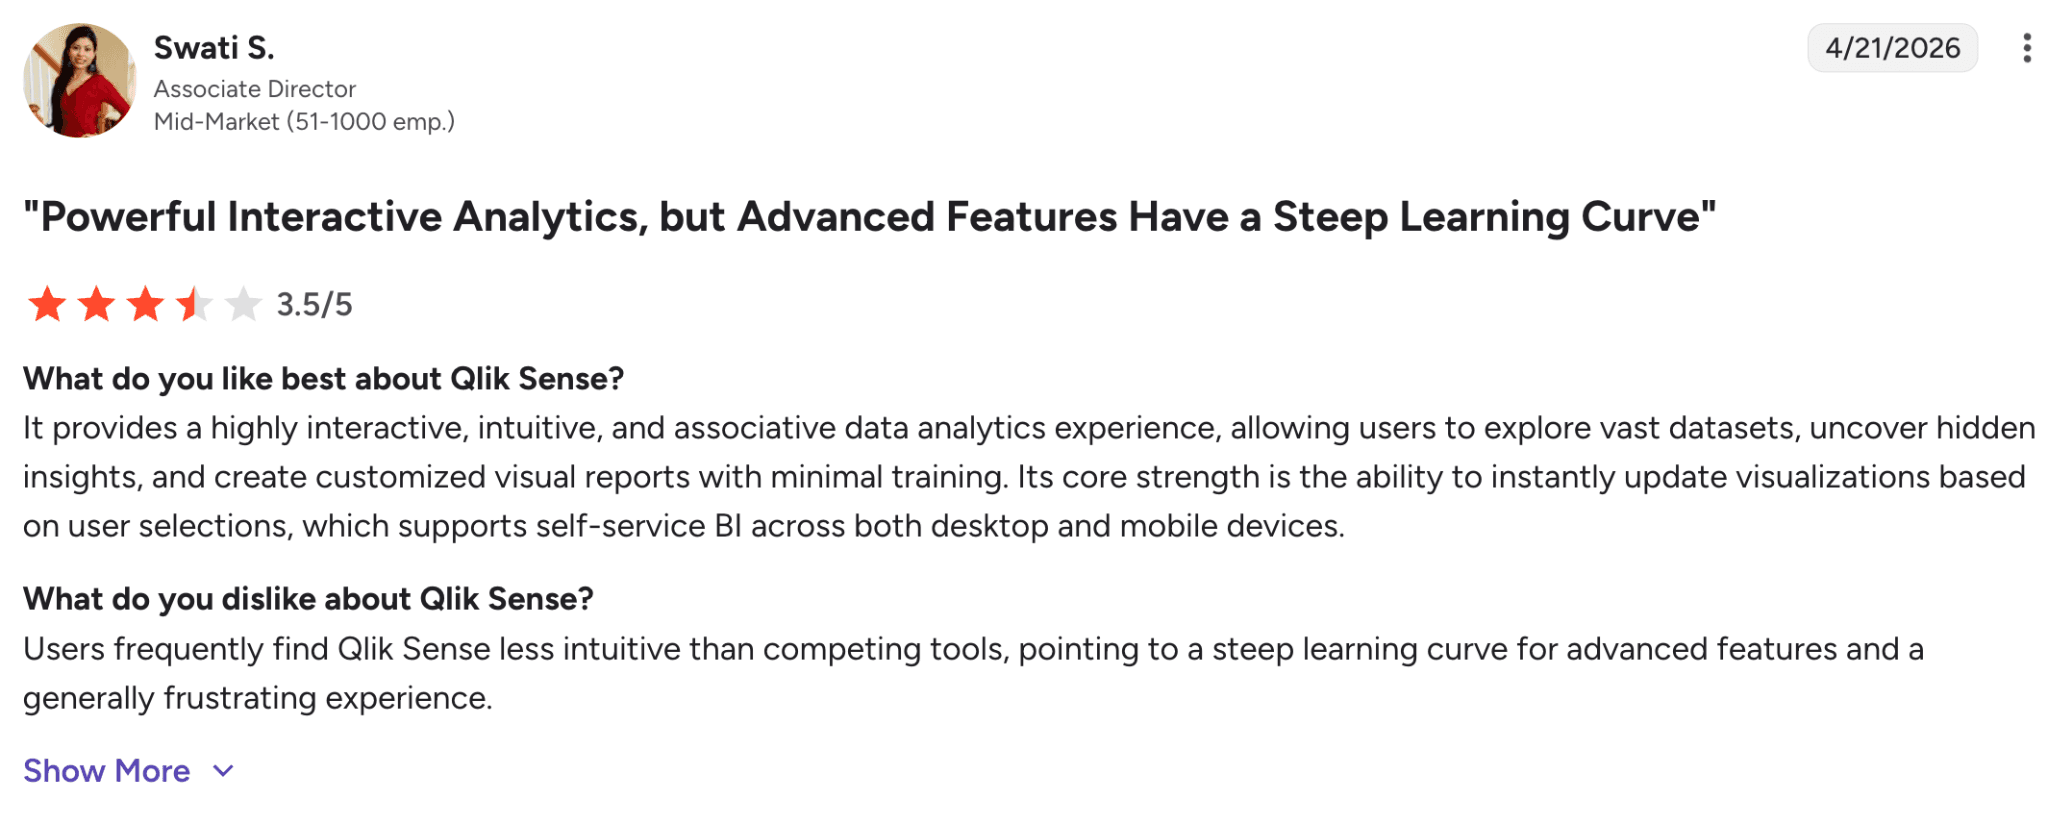
Cost and licensing add up: Qlik’s pricing is hard to understand. The starter plan starts at $300 per month for 10 users, but most of the features that make the platform valuable are available only in higher tiers. What looks like a reasonable entry point rarely stays that way.
Performance degrades at scale: Qlik’s in-memory architecture handles most workloads well, but as data scales to include complex transformations, reloads slow down, and the experience suffers. Many users consistently flag this on large, complex datasets.
Visualization options are limited: The default chart library covers the basics, but customization options are limited. Going beyond the pre-built templates means building custom extensions or bringing in development resources.
Comparing 8 Qlik alternatives
We reviewed eight Qlik alternatives across self-service capability, AI features, and pricing. Here is how they compare:
Tool | Best for | Self-Service capability | AI and automation | Pricing |
WisdomAI | Agentic intelligence with trusted, accurate answers across all your data. | Ask natural language questions, generate rich data visualizations, and get automated alerts. | Analytics agents that perform complex analysis, monitor your metrics, and surface trusted answers. | Custom (contact sales) |
Zoho Analytics | Building reports and getting AI-assisted answers. | Create dashboards and ask questions via Ask Zia. | Automated reports and an AI assistant that answers data questions in natural language. | From $60/month. |
Metabase | Simple, low-maintenance BI for smaller setups. | Build dashboards and explore data with a visual query builder. | Metabot AI answers natural language questions and generates chart summaries. | Tiered pricing plans. |
Domo | Connecting and reporting on data scattered across dozens of SaaS tools. | Pre-built dashboards and drag-and-drop report building. | AI-driven automation that triggers workflows. | Custom (Standard and Enterprise tiers) |
Amazon QuickSight | Scalable, cloud-based BI for the AWS ecosystem. | Ask questions in natural language and get instant visualizations. | Amazon Q for automated insights. | Tiered pricing plans. |
Visual storytelling and polished dashboards. | Build dashboards with drag-and-drop elements. | Einstein Copilot surface automated insights. | Tiered pricing plans. | |
BI that fits naturally into a Microsoft 365 environment. | Build dashboards with a familiar drag-and-drop interface. | Copilot generates reports, answers questions, and surfaces AI-driven insights. | Tiered pricing plans. | |
ThoughtSpot | Conversational data exploration. | Type a question and get visual answers. | Spotter as your AI assistant for data discovery. | Tiered enterprise plans. |
Let’s break down each tool and see how they change your workflow:
1. WisdomAI: Best for answers without the analyst queue
With WisdomAI, you skip the dashboard queue entirely. Ask questions in plain English and get AI-powered insights that are explainable, verifiable, and tied to your actual operations.
Qlik’s AI can answer the first question. But when you ask a follow-up or something outside the pre-built model, it either stops or starts hallucinating. WisdomAI’s Analytics Agents don’t have that ceiling. The Adaptive Context Engine understands your business context, including your definitions, metrics, and logic, so Agents can perform multi-step analysis across your entire data landscape and always arrive at a trusted answer.
You are free to ask follow-up questions, spin up AI dashboards, and drill into any insight without going back to the data team. Business users get immediate answers, and analysts get out of the reporting trenches.
Key features
Conversational BI: Ask business questions in plain English across any connected data source and get accurate, explainable answers.
Analytics Agents: Continuously scan your data, perform multi-step analysis, detect anomalies, and alert your team in real time.
Adaptive Context Engine (ACE): Codifies your business definitions and reconciles conflicting metrics for trusted, consistent answers
AI dashboards: Build and customize dashboards from a natural language prompt, with infinite drill-down from any tile.
Embed and integrate: SDKs and APIs for embedding insights into existing workflows and applications.
Pros
Business users get answers without SQL or scripting knowledge.
Answers grounded in your data and business definitions, not generic LLM output.
Handles both structured and unstructured data.
Proactive monitoring removes the dashboard dependency habit entirely.
Cons
Pricing requires a direct sales conversation.
2. Zoho Analytics: Good for building reports
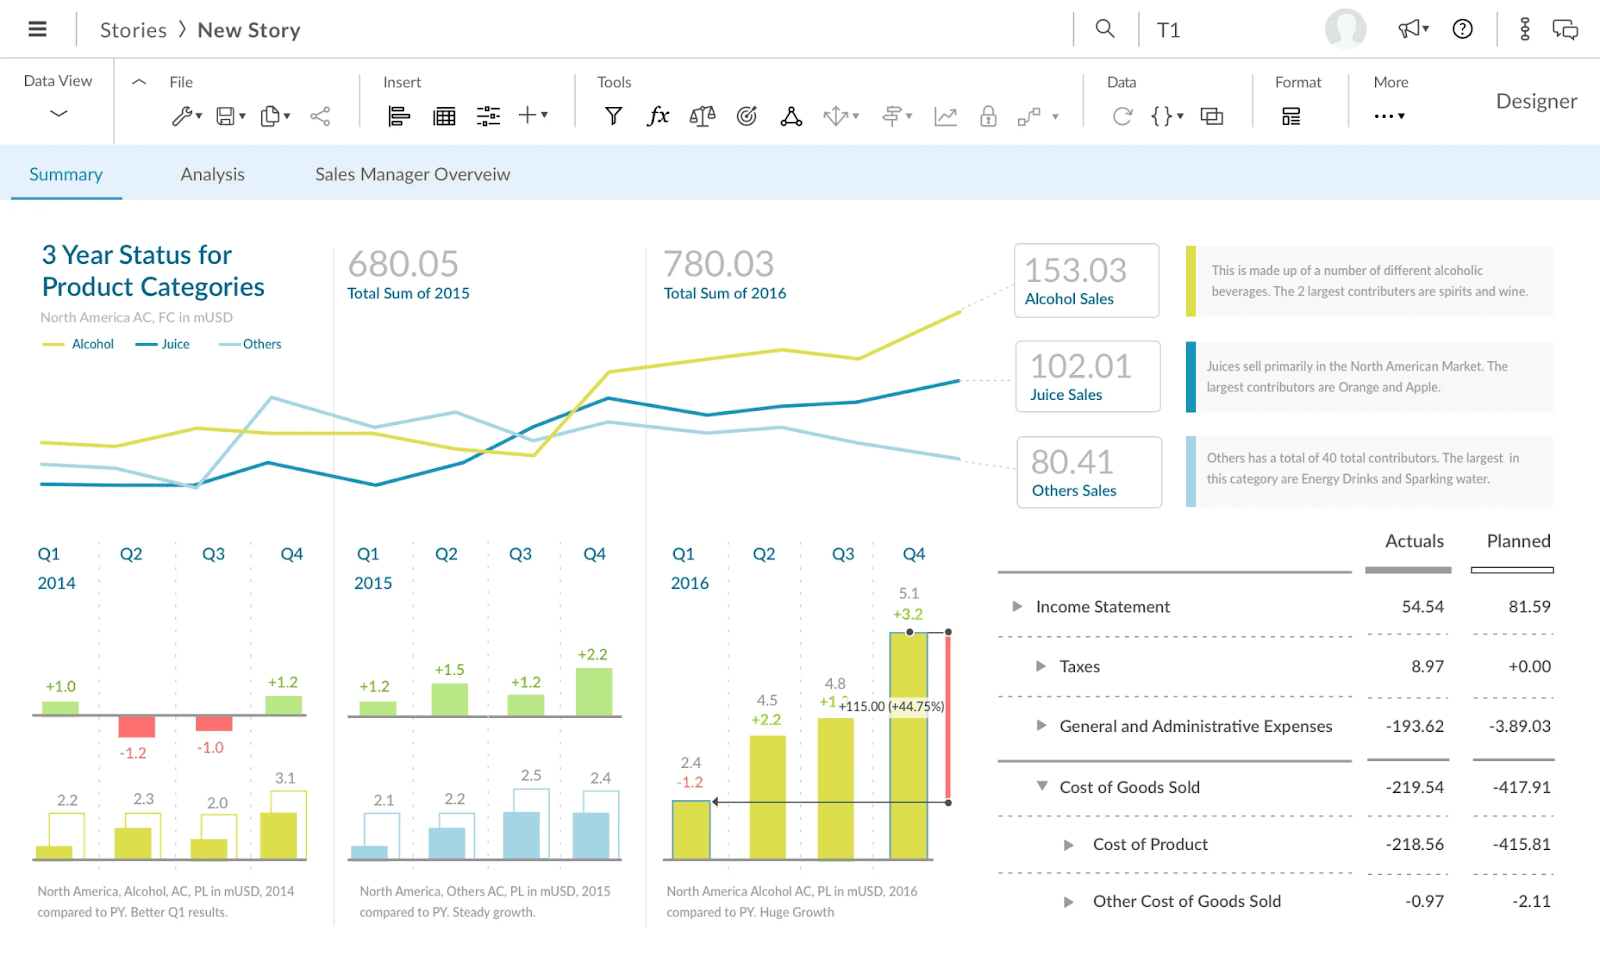
Zoho Analytics is for teams that want to build their own reports and dashboards. It connects to your data sources, automates data preparation, and provides a conversational AI assistant called ‘Ask Zia’ for natural-language queries.Compared to Qlik, the setup is more accessible, and the learning curve is gentler. Where it falls short is depth. Zoho gives your team the tools to build reports independently, but it does not proactively surface insights or handle the kind of multi-step analysis that removes analyst dependency entirely.For teams that need a straightforward, affordable BI tool without long training cycles, Zoho is worth a look.
Key features
Ask Zia: Ask data questions in plain English and get instant answers and chart summaries.
Data Preparation studio: Cleanse, transform, and shape your data using no-code functions.
Interactive dashboards: Build, filter, and drill into dashboards that reflect your data as it changes.
Data integration: Combines data across apps and departments into a single, consistent view of your business.
Pros
Connects to multiple data sources, which makes setup faster than most alternatives.
Good for basic reporting and visualization.
Affordable entry point compared to most enterprise BI tools.
Cons
The interface feels dated compared to other tools on this list.
Falls behind on flexibility and advanced features beyond basic reporting.
Load times slow down noticeably on large reports.
3. Metabase: Good for lightweight BI
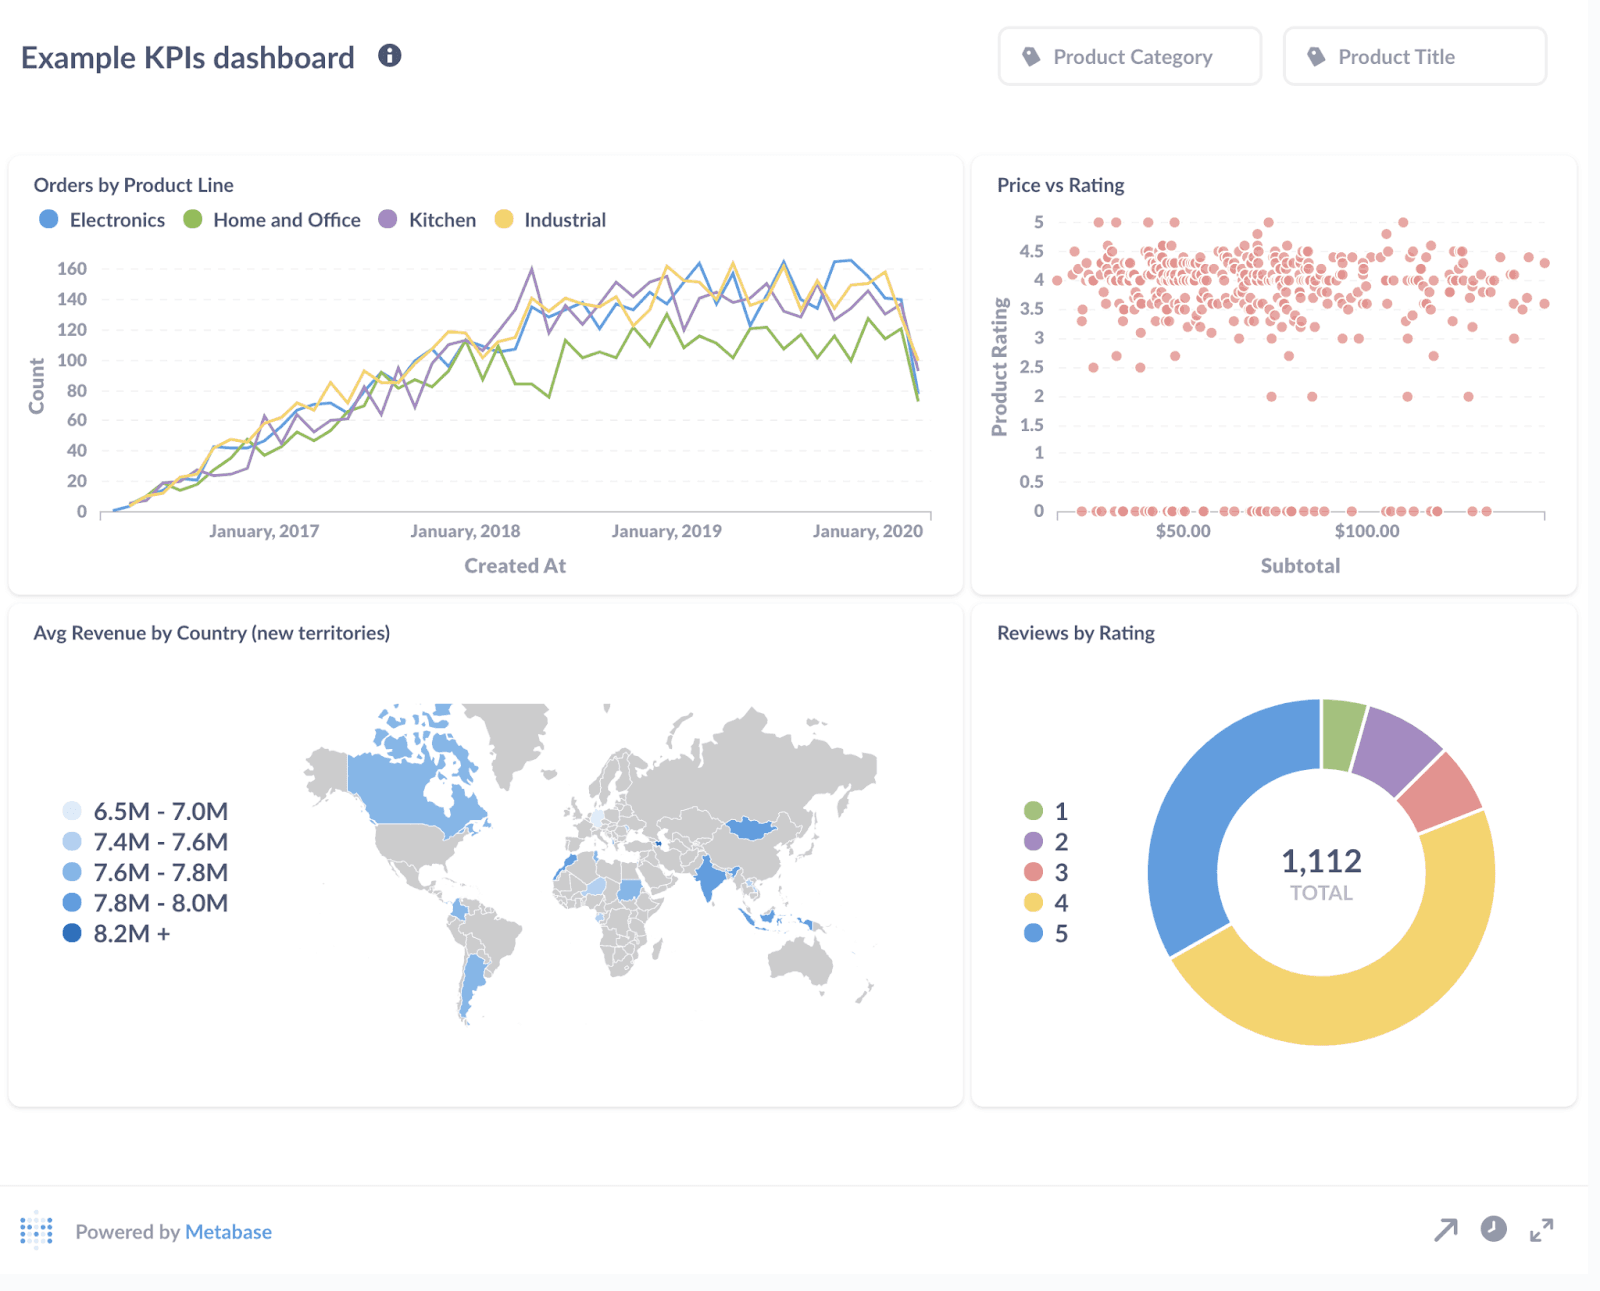
Metabase is the go-to BI tool for smaller teams that want a working setup without a lengthy implementation. It is open-source, deploys quickly, and lets business users connect to a database and start building charts.
It handles simpler reporting needs well. The limitation shows up at scale: once your data models get complex or your dashboards need enterprise-grade access controls, you will need additional tooling. Metabase did introduce Data Studio to address some of these gaps, but governance features are still early-stage and fall short of what most enterprise teams need.
If you are coming from Qlik and expecting the same depth of data modeling or access control, Metabase will feel like a step down. It is built for simplicity, not scale.
Key features
Data studio: Explore and transform datasets visually, apply filters and joins, and save results as reusable datasets.
Metabot AI: Natural language querying and chart summaries in Metabase Cloud.
SQL Editor: Full SQL access for more technical users who need it.
Permissions: Fine-grained control over who can see what data and which reports.
Embedded Analytics SDK: Integrates Metabase into other applications.
Pros
Deploys fast with minimal coding effort.
The free, open-source tier makes it accessible to startups and small teams.
Active community and strong documentation.
Cons
Governance is still early-stage: row-level security and audit trails are missing or limited.
Performance drops noticeably on large datasets.
Visual customization is limited compared to enterprise alternatives.
4. Domo: Good for consolidating a SaaS-heavy data stack
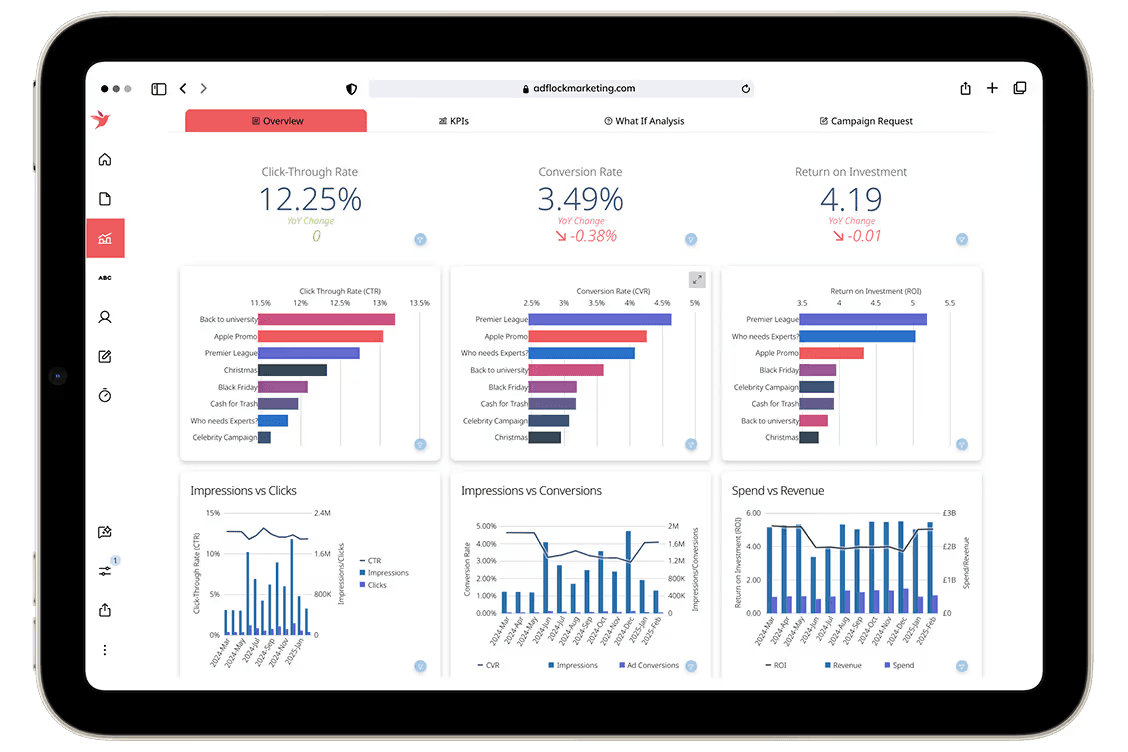
If your data lives across dozens of SaaS tools, spreadsheets, and warehouses, Domo’s core value is consolidating it all into one place. It reduces the data integration overhead that often comes with deploying Qlik.The trade-off is that some back-end tooling feels dated, and usage-based pricing can escalate quickly if you’re not careful about how your consumption grows. It’s a strong fit for business users who need real-time visibility across a broad set of data sources; less so for teams that need deep analytical capability.
Key features
Drag-and-drop ETL: Build and automate data pipelines visually.
Automated insights: AI agents that identify key drivers behind business metrics and surface anomalies.
Data connectors: Pre-built integrations with data warehouses like Salesforce and Snowflake.
Real-time alerts: Notifications when key metrics cross thresholds, delivered via web, email, or mobile.
Pros
Fast adoption for business users without technical training.
Real-time reporting and alerting across a broad set of data sources.
Embeddable dashboards for customer-facing apps.
Cons
Advanced features take time to learn.
Back-end development tooling feels dated in practice.
Usage-based pricing can escalate quickly without careful governance.
5. Tableau: Good for visual exploration
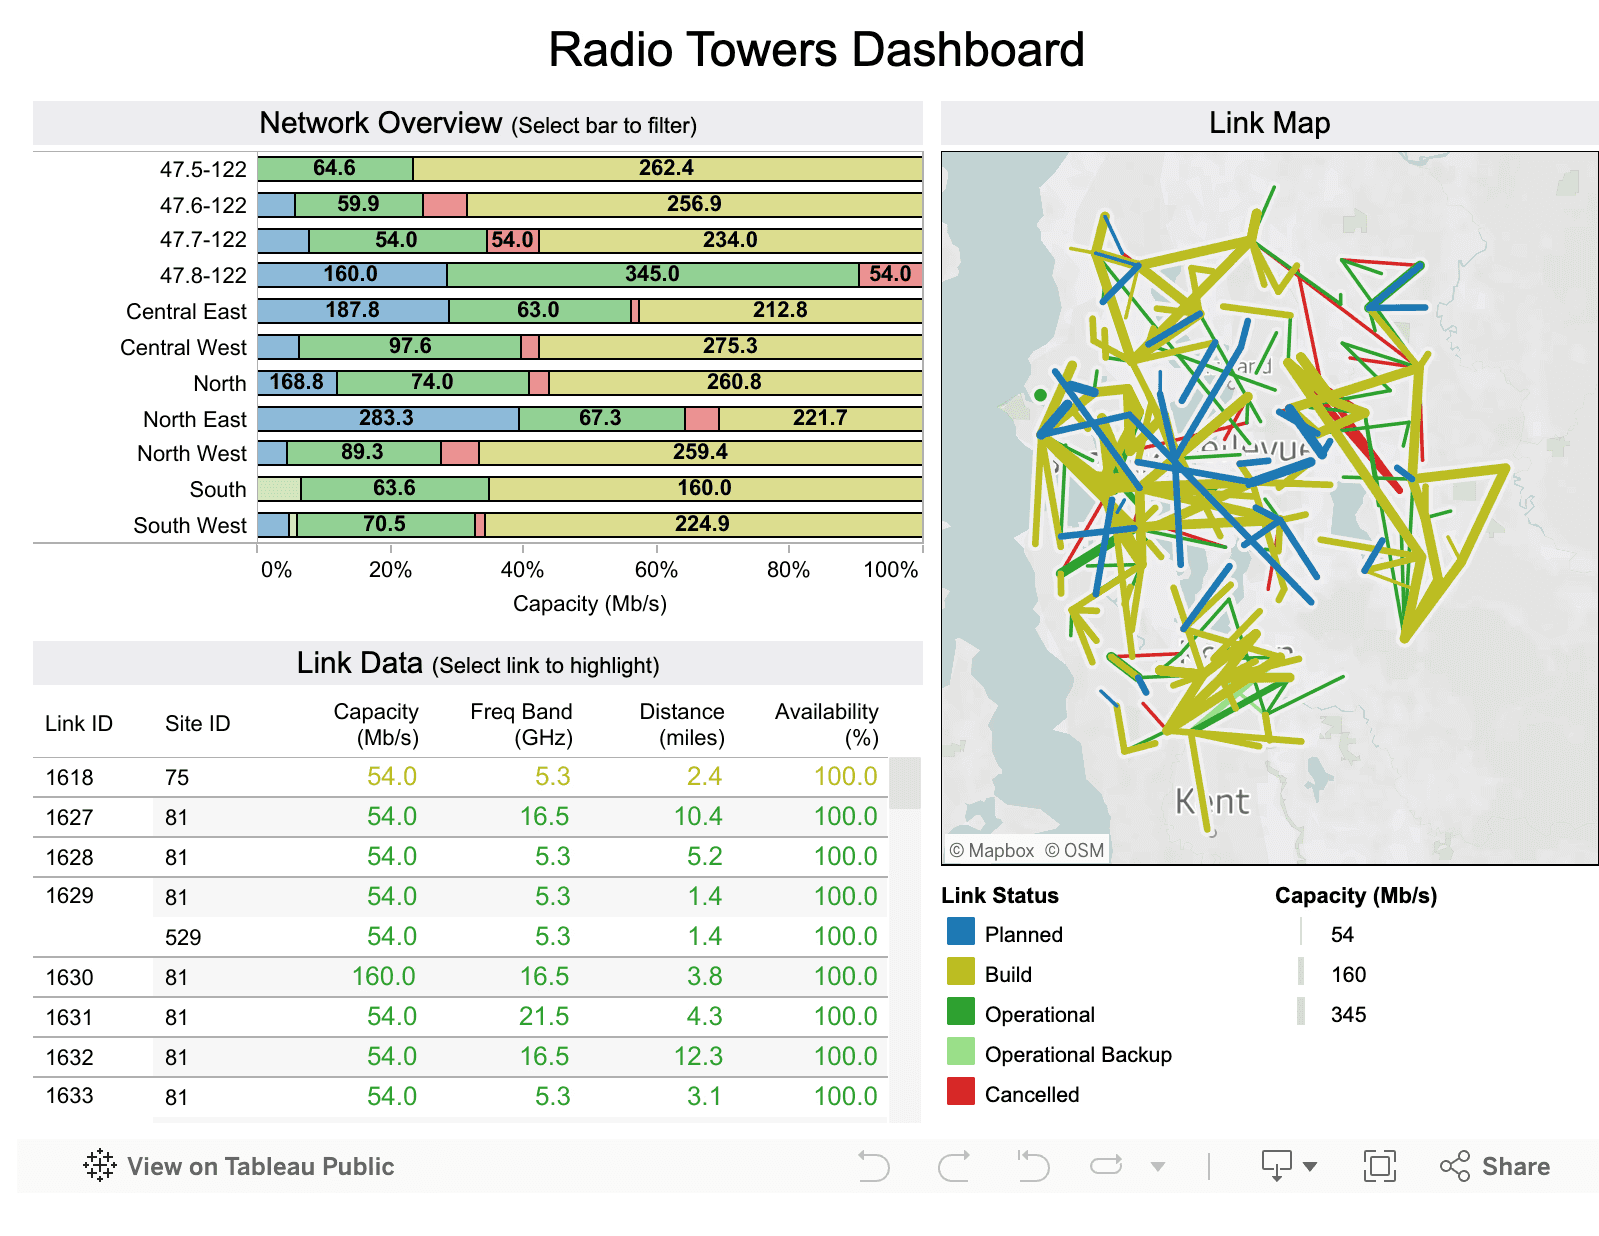
Tableau is the Qlik alternative you reach for when visual depth is your biggest requirement. Its chart library is well-known in enterprise BI, and the degree of control over layouts, colors, fonts, and interactivity is difficult to match.The catch: Tableau lacks a native semantic layer, making it harder to enforce metric consistency across dashboards than in Looker or Qlik. Complex data modeling typically requires separate tools like dbt, which adds cost and maintenance overhead. If you are leaving Qlik because of scripting complexity, Tableau does not fully remove that burden.
Key features
Drag-and-drop interface: Build charts, maps, and dashboards with minimal code.
Einstein Copilot: AI-assisted exploration, automated insights, and natural language queries.
Advanced visual analytics: One of the broadest chart libraries in enterprise BI.
Live data connections: Dashboards that update in real time as your data changes.
Pros
Best-in-class visualization quality and customization.
Works well across mixed data environments.
Large community with extensive resources and documentation.
Cons
No native semantic layer: metric consistency requires additional tooling and cost.
Advanced analytics features have a steeper learning curve.
AI features like Tableau Pulse are locked behind higher-tier plans.
6. Amazon QuickSight: Best for AWS-native teams
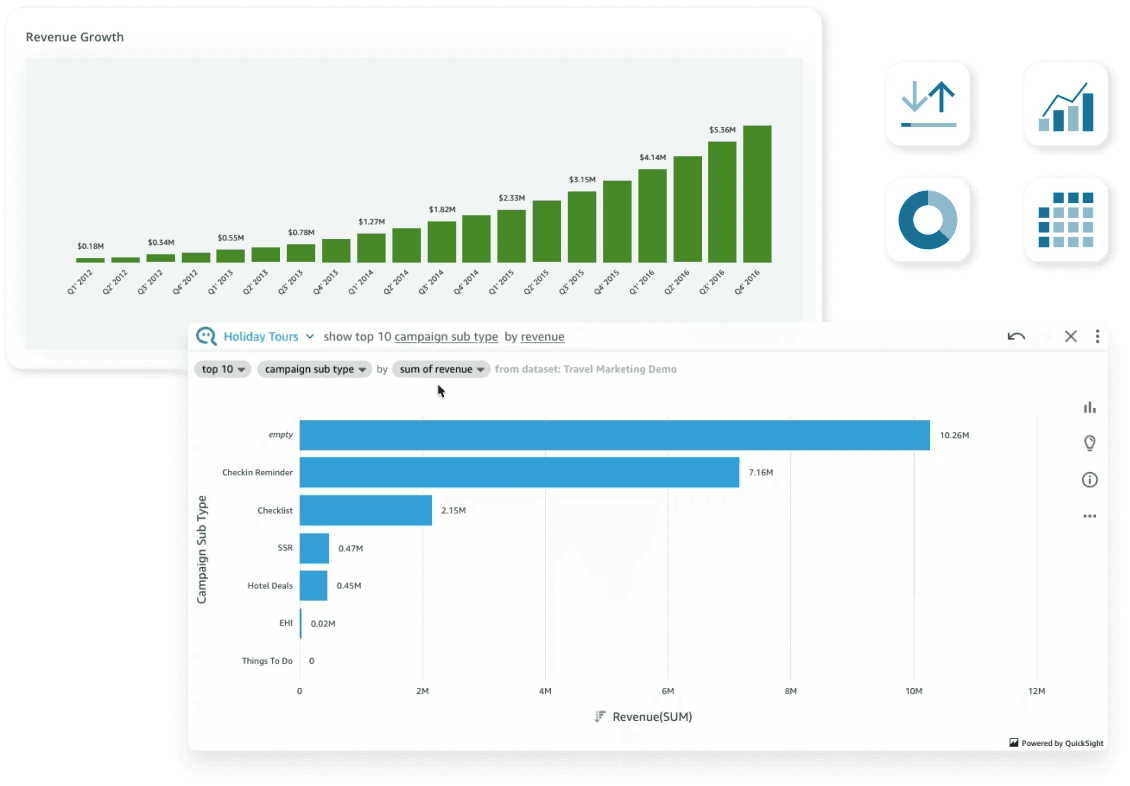
QuickSight is a cloud-native BI tool built to work closely with the AWS ecosystem. On the self-service side, Amazon Q lets business users ask questions in natural language, build dashboards, and explore data on their own terms.The AWS dependency is also its biggest limitation. Step outside that ecosystem, and the experience degrades fast. Visualization options are narrower than those of most tools on this list, and the data exploration approach is also more restrictive. Teams with multi-cloud infrastructure will find themselves working around gaps that other BI platforms handle natively.
Key features
Amazon Q: Natural language querying and AI-generated insights directly within QuickSight.
SPICE In-Memory Engine: Fast query performance for large datasets and responsive dashboards.
Native AWS integration: Direct connections to Redshift, S3, Athena, and other AWS services.
Embedded Analytics: Embed dashboards into customer-facing apps with customizable branding.
Automated Reporting: Recurring reports with scheduled delivery via email or Slack.
Pros
Simpler pricing, especially for smaller teams.
Fast setup if you are already deep in the AWS ecosystem.
Enterprise-grade governance and security, including row-level access controls and SSO.
Cons
Visualization options are narrower than those of Tableau or Power BI.
The data modeling approach is restrictive.
A poor fit for teams working outside AWS.
7. Power BI: Best for Microsoft-first environments
Power BI is a natural fit for organizations already running on Microsoft 365. It connects natively with Teams, Excel, and Azure, which removes most of the integration overhead that comes with evaluating a new BI tool in a Microsoft-heavy stack. Power BI makes visualization easy. With a drag-and-drop interface, you can build custom dashboards and visualizations. But it runs on DAX and Power Query, so getting answers outside the model still requires an analyst. Copilot helps, but it is not there yet.
Key features
Copilot integration: Natural language queries, AI-assisted report creation, and DAX generation.
Drag-and-drop dashboard builder: Accessible for both technical and non-technical users.
DAX and Power Query: Data modeling for complex metrics and custom transformations.
Microsoft 365 integration: Native connectivity with Teams, SharePoint, Excel, and Azure.
Pros
Tightly integrated with tools most Microsoft-native teams already use daily.
Broad visualization library.
Large user community and extensive third-party documentation.
Cons
Performance degrades on large datasets and complex models.
DAX is a real learning curve for users doing anything beyond basic reporting.
Licensing complexity grows as team size and feature requirements expand.
8. ThoughtSpot: Best for search-driven analytics
ThoughtSpot built its reputation on one idea: you should be able to type a question and get a visual answer. Its natural language search delivers on this promise by working across your connected data, and the Spotter AI assistant handles anomaly detection and trend analysis on top of it.The limitation is scope. ThoughtSpot works well with structured data but struggles with unstructured data or anything outside a clean warehouse. Pricing is steeper than most tools on this list, so worth reading the details before you commit.
Key features
Search-driven analytics: Natural language queries that generate instant visual answers from your data.
Spotter AI Assistant: Identifies anomalies, detects trends, and explains what changed in your data.
Liveboards: Real-time, interactive dashboards with drill-down and embedding capabilities.
Enterprise data connectivity: Cloud warehouses, on-premises systems, and legacy databases.
Pros
Business users can query data directly without analyst involvement.
Strong enterprise data integration and governance.
Real-time dashboards with drill-down options.
Cons
Limited support for unstructured data
Pricing is complex and expensive at higher tiers
Advanced features still require technical setup and oversight.
Stop making your business users wait
Most tools on this list reduce the analyst’s workload. But the dependency never fully goes away. It just shifts its shape. To make self-service a reality, your business users need answers on their own terms, not on the analyst’s timeline.
WisdomAI kills the problem at its root. Ask a question, get an answer, and keep drilling until you have the full picture, across structured and unstructured data. The gap between a question and a decision closes completely.
Your business users are done waiting. Book a demo today.
FEATURED RESOURCES

Embedded Analytics Tools: A Buyer’s Guide for 2026
Tools
Embedded Analytics Tools: A Buyer’s Guide for 2026
BI Tools Comparison: AI Capabilities and Features Comparison
Tools
BI Tools Comparison: AI Capabilities and Features Comparison
Looker vs Tableau in the Generative AI Era
Tools