Guide
Generative BI: From dashboard backlogs to instant answers
Generative BI was supposed to end dashboard sprawl for good. The promise was simple: You ask a question, and you get an answer in minutes. That ticketing queue and the two-week wait? Gone.
Except it's not that straightforward. As one practitioner noted: Natural language querying in BI is not new. The conversational interface works. The hard part is making it reliable and governed enough that people actually trust the answers.
That's what this piece is about: What generative BI is, where it pays off, and what it takes to make AI-driven insights trustworthy.
What is generative BI?
Generative BI is a new class of business intelligence that uses large language models (LLMs) to make data analysis conversational. You type a question, the platform queries the relevant data sources, and returns an answer.
What separates the good platforms from the basic ones is what happens after that first answer. Ask "What was our revenue last year?" and most analytics tools stop at the first number. A good one shows you why it changed, which segments drove it, and what's worth looking at next. One question opens up the whole thread.
What can a generative BI platform do?
Every GenBI platform promises self-service analytics. These are the core capabilities that deliver it:
Natural language processing
Natural language processing lets you skip SQL entirely. You type a question in plain English, and the system works out what you need: the metric, the time period, and the grouping.
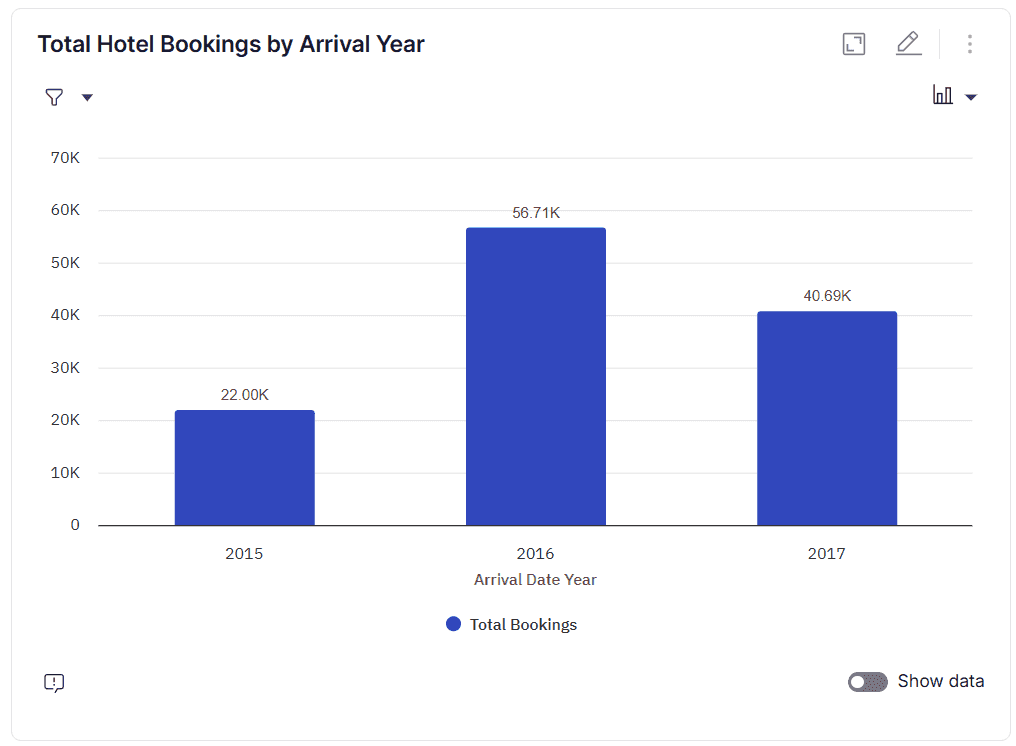
Take a simple example. You ask: "How many bookings were made each year?" Behind the scenes, the system breaks that into steps:
Find the right table (hotel_booking_xhtn)
Pick the column to group by year (arrival_date_year)
Count the total bookings per year
Sort the results chronologically
From there, it generates the SQL, runs the query, and returns a visualization that answers your question.
All your data, one interface
Your data is spread across your CRM, ERP, spreadsheets, PDFs, and probably a few sources nobody's documented yet. Generative BI connects to all of them through pre-built integrations and APIs, pulls in the schemas and metadata, and builds a unified layer on top. Structured data from your warehouse sits alongside unstructured content like support tickets, analyst notes, and internal documentation — all queryable from the same interface.
Automated reporting and visualization
GenBI automates the reports your team currently builds manually. You can simply describe what the report should cover, including the metrics, the time range, the audience, and the platform does the rest. It pulls the data, writes a narrative summary explaining what happened and what changed, generates the right charts, and flags anything worth taking a closer look at. Visuals and dashboards work the same way. Ask a question and get a chart. The Monday morning report that used to take three hours gets delivered automatically, ready to share
One definition of every metric
A semantic layer defines how your business metrics are calculated and enforces that definition across every query. When two people ask the same question, they get the same number, because the platform only knows one way to calculate it.
Without this layer, the LLM guesses what "revenue" means from column names and gives you a number that looks right but isn't. We'll dig more about how this breaks in production and what to do about it in the challenges section.
Answers that reflect current data
Traditional BI runs on weekly or scheduled refreshes. Your dashboard shows what the data looked like when someone last updated it, which could be days old by the time you're making a decision.
GenBI queries your live data. When you ask a question, the answer reflects what's happening now, not what a snapshot captured last Monday. This matters most when decisions are time-sensitive.
Exploratory analysis and deeper data discovery
Traditional BI locks you into pre-built views. If the dashboard doesn't show the breakdown you need, you have to wait for someone to build it.
GenBI lets you explore conversationally. Ask a question, and the system suggests follow-ups based on what the data shows. Point it at an unfamiliar dataset, and it tells you what's in there and suggests questions worth asking. You can drill into different dimensions, change groupings, and chase a thread of analysis without filing a single request.
Generative BI vs traditional BI: A quick comparison
Think of traditional BI as the system of record. GenBI is the system of inquiry. One shows you what was built. The other lets you follow your line of curiosity. Here’s how they diverge:
Aspect | Traditional BI | Generative BI |
Interaction model | Static dashboards and fixed views. You see what was built, and follow-up questions require a new report. | Queries live data and supports conversational follow-ups in the same thread. |
Data Access | Works with structured data in warehouses and databases. Unstructured data, like PDFs, spreadsheets, and documents, is difficult to incorporate. | Queries structured and unstructured data, including CRMs, ERPs, spreadsheets, PDFs, and internal documentation. |
Who can use it | Requires SQL, DAX, or a specific BI tool. Business users depend on analysts for anything beyond predefined reports. | Anyone can query data in plain language. No technical skills required. |
Speed of new Insights | Existing reports refresh fast. New questions take days or weeks because someone has to build a new view. | New questions get answered in the same conversation, in real time. |
Analysis Depth | Strong at descriptive analytics: what happened. Digging deeper requires a complex setup and custom queries. | Supports follow-up questions, cross-dataset exploration, and deeper drill-downs through a conversational interface. |
Reporting | Automates data refresh and scheduled distribution. New reports and narratives are manual. | Generates full reports with written summaries, charts, and anomaly callouts from a single prompt. |
Use cases for business and product leaders
Contract intelligence for procurement
Procurement teams juggle hundreds of contracts across vendors, regions, and renewal cycles. When a renewal hits, your team pulls the contract, digs through spend history, and compares terms manually. For teams managing dozens of renewals a quarter, that prep work can stretch across weeks.
GenBI compresses it. A procurement lead asks, "Which contracts renew in Q3 and how does pricing compare to what we've paid historically?" and gets a consolidated answer in minutes. The week of research before a negotiation becomes a single query.
This isn't a hypothetical problem. Bharat Rajan, Director of Source to Pay and Transformation at Arm, describes how procurement teams spend months manually reconciling data before they can even begin the actual analysis:
Real-time visibility into account health
Say a mid-market account that was using your platform daily drops to once a week. They stop attending onboarding sessions and don't respond to the CSM's follow-up. By the time any of this shows up in a dashboard, that account has already started evaluating competitors.
The signals were all there. They just lived in three different systems, and nobody connected the dots fast enough. GenBI makes those signals queryable in real time. A sales leader asks, "Which accounts have had a usage drop this week?" and gets a list they can work through that afternoon. Your team reaches out while the customer is still on the fence, not two weeks after they've made up their mind.
Embedded analytics for your product
The analytics feature your customers keep asking for isn't another dashboard. It's the ability to explore their own data and get answers without waiting for your data team to build the view.
Most product teams either bolt on a charting library and call it analytics or spend years building something in-house that still frustrates users.
Embedding GenBI takes a different approach. Your customers ask questions about their data in plain language and get governed answers in real time. Meanwhile, your engineering team stops maintaining dashboards and starts focusing on your core product.
Blend went this route. They embedded WisdomAI directly inside their platform and cut time-to-insight from seven days to near-instant. Lenders can now ask questions, get answers, and act on them, all without leaving Blend.
Challenges of generative BI (and how to solve them)
Generative BI makes data more accessible. But that accessibility is also where most problems start. The interface is polished enough that every answer looks trustworthy until the cracks start to show.
Here's what to watch for before you commit.
The black box problem
A finance analyst asks GenBI for quarterly revenue by product line. The number looks reasonable, so she drops it into a pricing model and sends it to the team. Two days later, someone cross-checks against the source system, and the numbers are off. Nobody can tell which tables were queried or how multi-currency conversions were handled.
That's all it takes. One untraceable wrong answer, and the analyst is back to manually double-checking every output.
The fix is traceability. Any platform you evaluate should surface a full evidence trail for every answer: which tables were queried, which metric definitions were applied, and how the calculation was performed. If that trace takes more than 30 seconds to pull up, the platform isn't ready for decisions that carry real weight. When someone asks where a number came from, the trail should be one click away.
The stale context problem
This one gets the least attention and causes the most production failures.
Most GenBI platforms take your full schema, feed it into the LLM's context window, and let the model decide what's relevant on its own. Sometimes it gets the context right. Most times, it hallucinates by picking the wrong table or confusing two metrics with similar column names.
But the more dangerous failure is stale context. Say your data team renames a column from net_revenue to net_revenue_adjusted and adds a new net_revenue that excludes returns. The schema changed. The model's understanding didn't. Every query about net revenue now returns the wrong number—and the answers look perfectly reasonable because they're based on definitions that used to be accurate.
This is why context has to be adaptive. WisdomAI's Adaptive Context Engine is built around this problem. It continuously ingests metadata and documentation, flags conflicting definitions, and detects when your data environment has drifted. The model never sees the full schema. It gets a curated, governed slice relevant to that specific query.
Security and access control
Every GenBI vendor talks about democratizing data. Fewer talk about what happens when that democratization moves faster than your access controls can keep up.
When a regional manager asks about revenue, they should see their region, not the company's. When a customer uses embedded analytics, they should see only their own data, never another customer's.
These aren't hypothetical scenarios. They're the first thing that goes wrong in any real deployment. Access controls need to be enforced at the query layer, not just the interface. Row-level security, column-level permissions, and audit logging aren't nice-to-haves. They're the baseline for any platform you'd trust with production data.
Put generative BI to work for you
GenBI works when the foundation is right. That means governed metric definitions, AI-ready data, proper access controls, and a context layer that stays current as your data environment shifts.
Most platforms nail the conversational interface and stop there. WisdomAI goes deeper. Every answer comes with a full lineage trace, built on an Adaptive Context Engine that continuously learns your data environment so the output stays accurate and defensible over time.
Stop waiting on analysts. Book a demo and see generative BI in action.