Guide
7 best big data analytics tools for better insights
The baseline for modern big data analytics tools has shifted. Anyone can generate a chart now. The real question is whether your platform does anything beyond that.
For most teams, it doesn’t. Analysts remain buried in pipeline work, and business users don't really trust the AI outputs they receive. We've put slicker interfaces on top of our data, but the actual speed of decision-making hasn’t changed.
To break that cycle, you need analytics platforms that automate data prep, support ML workflows, and ground every number in business logic so no one has to second-guess the results.
Let’s understand this a little better.
The shift in big data analytics
Big data analytics tools turn raw data into something the business can actually use. This process involves ingestion, transformation, storage, modeling, querying, and reporting.
Historically, it was incredibly hard to get all your data into one place, query it quickly, and give business users a way to explore it. Today, almost every platform does those things well enough that they've stopped being differentiators.
What matters now is further upstream and further downstream. Upstream: Can the platform reduce the pipeline work, eating into analyst capacity? Downstream: Can the numbers it produces be trusted? And in the middle: can it support ML workflows without requiring a separate stack?
Those are the questions data leaders should evaluate now. And here are the big data analytics tools that actually meet that standard.
The top 7 big data analytics tools
WisdomAI
Apache Spark
Looker
Tableau
KNIME
Microsoft Azure Synapse Analytics
Qlik Sense
Big data analytics tools at a glance
Tool | Category | Key Strengths | Limitations | Who’s it best for | Pricing |
|---|---|---|---|---|---|
WisdomAI | Agentic Analytics Platform | Conversational agents,NLP-based data extraction, semantic foundation, and unified analysis across structured and unstructured data. | Pricing requires connecting with the team and a relatively newer category | Business teams, executives, and analysts who need trusted answers without SQL querying | Custom |
Apache Spark | Distributed Processing Engine | In-memory compute, unified workloads (SQL/ML/streaming), and supports multiple coding languages. | Requires strong infra + expertise: not a BI on its own. | Data engineers and ML teams handling large-scale transformation | Free (open source); infrastructure and managed services cost extra |
Looker | Enterprise BI Platform | LookML semantic modeling layer, governed data access, and broad cloud warehouse connectivity | Steep LookML learning curve; quote-based pricing with annual commitment only | Enterprise data teams that want governed, consistent metrics across the business | Custom |
Tableau | BI and Visualization | Drag-and-drop dashboard and huge connector library | Performance degrades on very large datasets without a well-modeled source; primarily a consumption layer, not a data platform | Business users and analysts who want to visualize insights | Starts at $15/user/mo; contact sales to get a quote on higher tiers |
KNIME | Open-Source Analytics | Visual workflows, ML extensions, Python/R/Hadoop integrations | Learning curve for the node-based paradigm; enterprise features gated behind the KNIME Business Hub | Data scientists, analysts | Free plan available; contact sales to get a quote on paid plans |
Azure Synapse | Unified Analytics | SQL, Spark, and data integration in one workspace; tight fit with the Microsoft stack | Setup and workspace configuration is complex; best value in Microsoft-heavy environments | Microsoft-centric enterprises consolidating warehousing, big data, and integration | Usage-based |
Qlik Sense | BI withAssociative Analytics | Associative model, real-time insights, R/Python integration | Per-user pricing gets expensive at scale; setup complexity in larger deployments | Mid-market and enterprise teams that want exploratory analytics beyond linear dashboarding | $300–$2,750+/mo |
1. WisdomAI
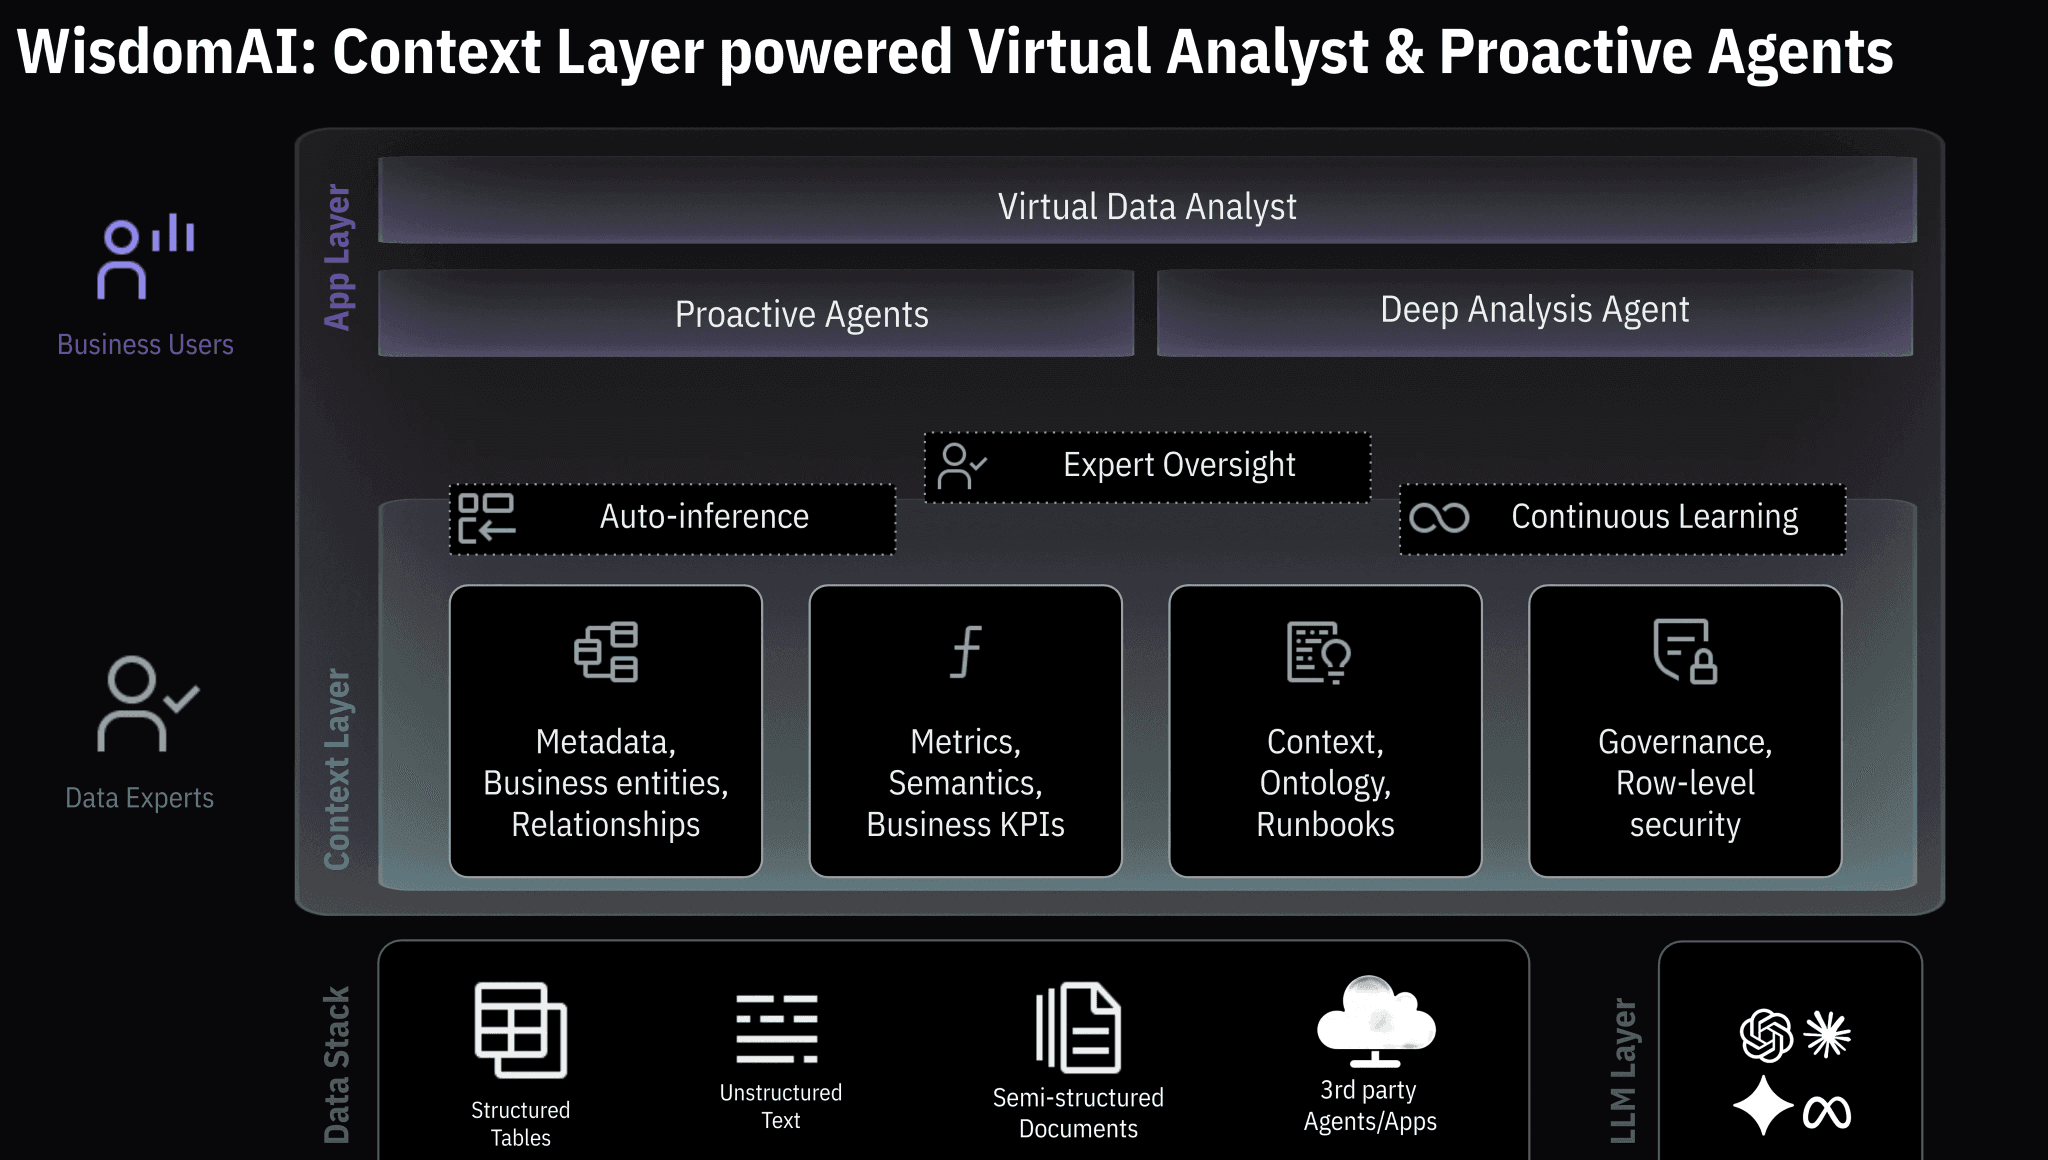
WisdomAI’s Agentic Intelligence Platform is built specifically to bridge the gap between AI speed and enterprise trust. Instead of relying on lossy LLM text summaries, WisdomAI operates on a deterministic context layer that tracks your live metrics, entity relationships, and business definitions—the actual semantics your data team has already defined —so answers stay grounded in your reality.
You can ask questions in plain English and get fully auditable answers, with every insight tied back to its exact data source.
For modern data teams, it analyzes across structured and unstructured sources in a single flow, while operating within the role-based access controls and security policies you already have in place.
Key Features
Natural Language Querying: Ask questions in everyday language, without needing to write complex queries.
Real-Time Insights: Get immediate answers and visualizations to make decisions on the fly.
Cross-Data Integration: Combines structured (e.g., CRM, ERP) and unstructured (e.g., text, documents) data in one place.
Proactive Alerts: Get notified of important changes, anomalies, or trends in your data as they happen.
Customizable Dashboards: Personalize dashboards to reflect the metrics that matter most to your business.
Automated data ingestion from CSV or databases: Lets you upload CSV files or connect to databases like PostgreSQL, Snowflake, or BigQuery. This makes it easy to bring existing data into WisdomAI and start analysis quickly.
Enterprise‑grade security & compliance: Offers row‑level security, role-based access, and compliance with standards such as SOC 2, HIPAA, and GDPR,
Pros
Provides answers in minutes, helping you make quick decisions.
Built to handle both structured and unstructured data, offering a deeper analysis.
Automatically alerts you to important data changes, so nothing slips through the cracks.
Dashboards and features can be tailored to your specific business needs.
Cons
Relatively newer to the category.
2. Apache Spark
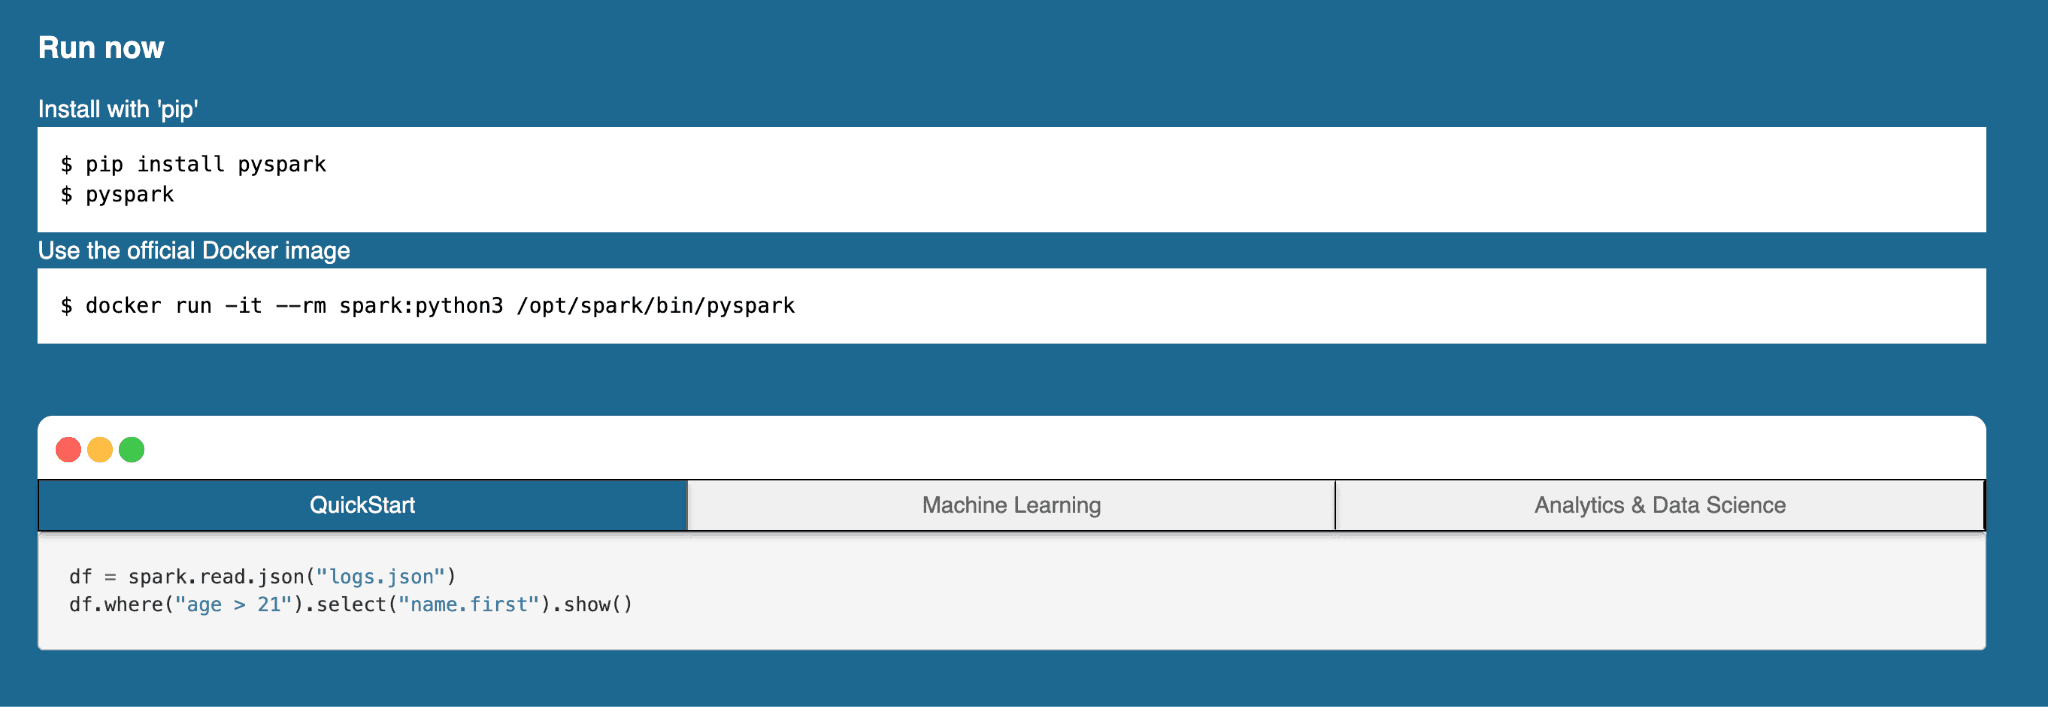
Apache Spark is an open-source tool for crunching huge amounts of data quickly. It does this by breaking down the work across a cluster of machines rather than relying on a single machine.
Most data teams don't run Spark directly anymore; they use it through managed services like Databricks to handle batch processing, streaming, machine learning, and graph workloads in a single framework.
Just remember, though: Spark is not a warehouse or a BI tool. You still need something on top of it to query and visualize results.
Key Features
In‑memory computing: Processes data in RAM for much faster performance than disk‑based systems.
Unified workloads: Supports batch jobs, streaming, SQL queries, machine learning, and graph analytics in one platform. Supports batch, streaming, SQL, ML, and graph analytics in one engine.
Multiple language support: Lets users build applications in Java, Python, Scala, or R.
Fault tolerance: Uses distributed data structures that allow recovery if nodes fail.
Flexible deployment options: Runs on Kubernetes, Hadoop YARN, Mesos, standalone, or as a managed service.
Pros
Delivers significantly faster processing than most legacy tools.
One engine covers batch, streaming, and ML, so you're not running three separate systems.
Works well with existing data ecosystems like Hadoop and cloud storage.
Cons
Needs significant memory and computing power for optimal performance.
Requires skilled engineering resources to set up, tune, and maintain.
Needs an additional layer on top for querying and visualization.
3. Looker
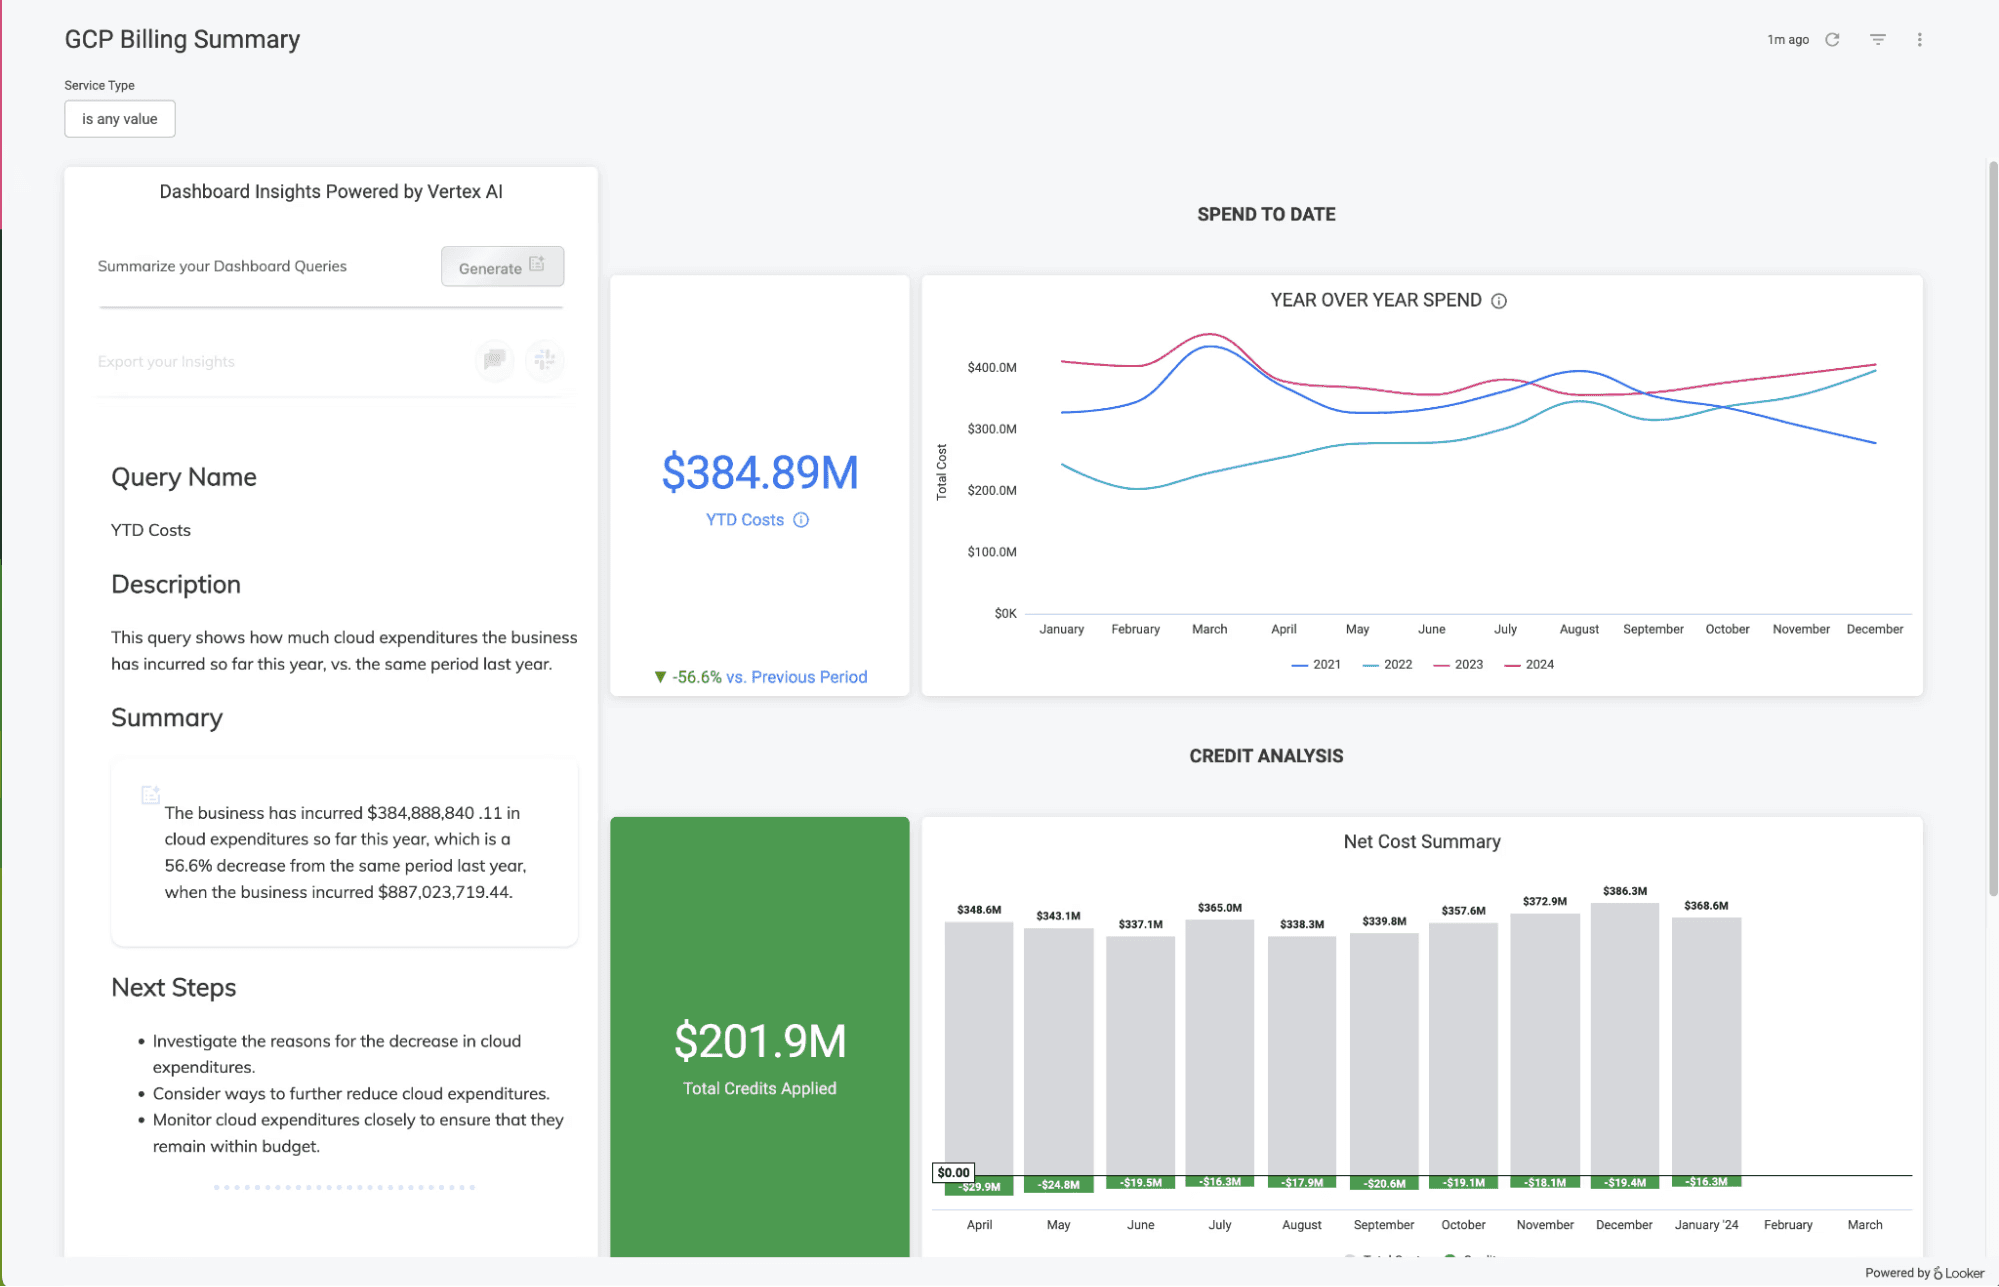
Looker is Google Cloud's enterprise BI platform, built around LookML, its modeling layer. Instead of letting every report define metrics on its own, your team writes business definitions once in LookML, and every query inherits them. A metric like "active customer" returns the same number in a finance dashboard or a marketing report.
The platform doesn’t just visualize warehouse data, it also controls how that data is interpreted. However, the setup complexity is high since Looker is proprietary and modeling a complex business in it significant engineering time.
Key Features
LookML modeling layer: Define metrics and relationships once, and every report and query uses the same logic
Governed data access: Row-level permissions and access controls keep sensitive data restricted by role
Broad database support: Connects to most major cloud warehouses and SQL databases, not just BigQuery
Embedded analytics: Push dashboards and reports into your own products or customer-facing apps
Conversational analytics APIs: Build multi-turn, agentic query workflows on top of the governed semantic model
Pros
The LookML layer keeps metric definitions consistent across every report and team
Strong governance and role-based access suit enterprise security requirements
Connects to a wide range of warehouses, so it is not locked to one backend
Cons
LookML is proprietary, and modeling a complex business in it takes significant setup time
No public pricing or self-service signup to estimate cost without an upfront commitment
Per-viewer licensing adds up quickly at scale, limiting large or customer-facing deployments
4. Tableau
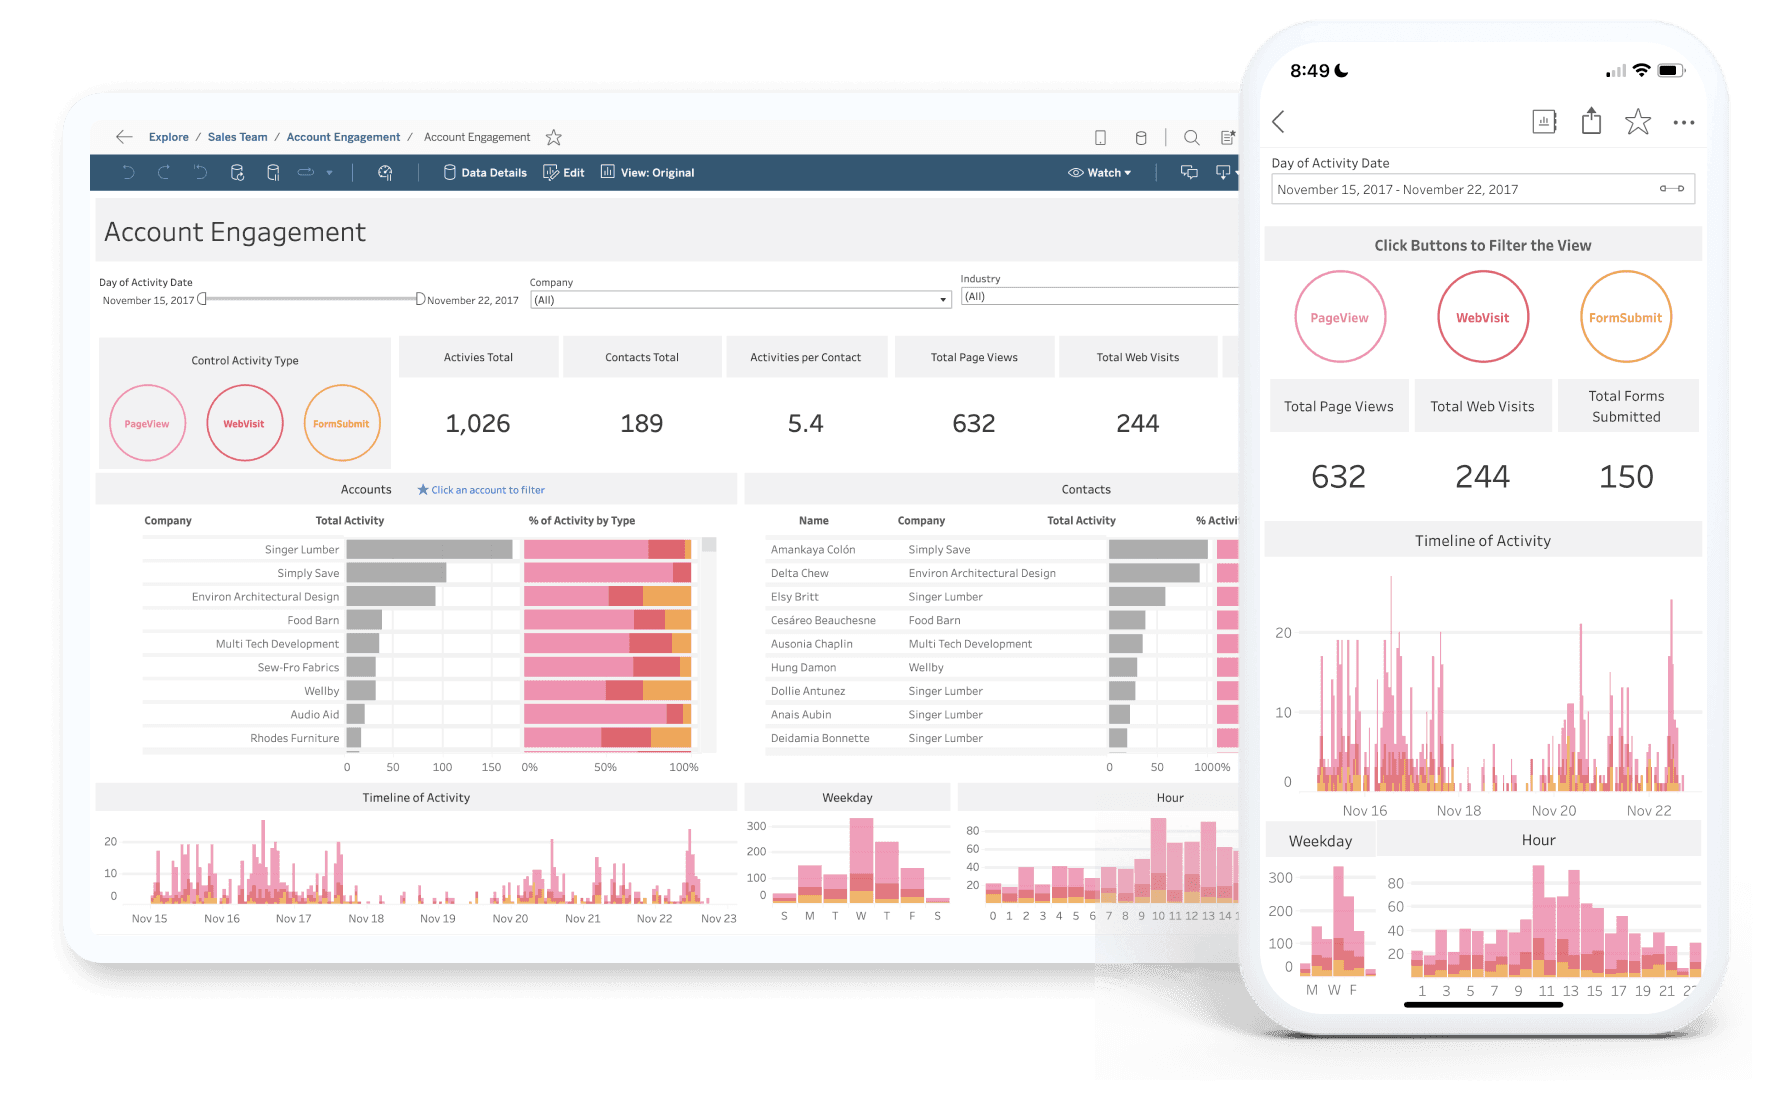
Tableau is a BI and visualization tool, not a big data platform in its own right. But most data teams adopt it for a reason, it's the interface layer that turns warehouse data into something a business user can actually work with. It connects to the major cloud warehouses (Snowflake, BigQuery, Redshift), handles large datasets reasonably well when the source is well-modeled, and has the broadest connector library in BI.
Key Features
Interactive dashboards: Create dynamic, customizable dashboards that update in real-time.
Data integration: Connects with various data sources like Excel, SQL databases, and cloud platforms.
Real-time data updates: Keeps data current with real-time updates from connected sources.
Advanced visualization library: Supports maps, scatter plots, treemaps, forecasts, and statistical models.
Extensions & APIs: Integrate custom applications, embed dashboards, or extend the tool with advanced analytics.
Pros
Drag-and-drop functionality makes it easy to create complex visualizations.
Easily integrates with a wide range of data sources.
Highly polished visualizations help teams tell compelling data stories without design skills.
Cons
Can experience slowdowns with extremely large or complex data sets.
Per-user pricing can escalate quickly if you want advanced features.
Static dashboards don’t answer follow-up questions without manual updates or data team involvement.
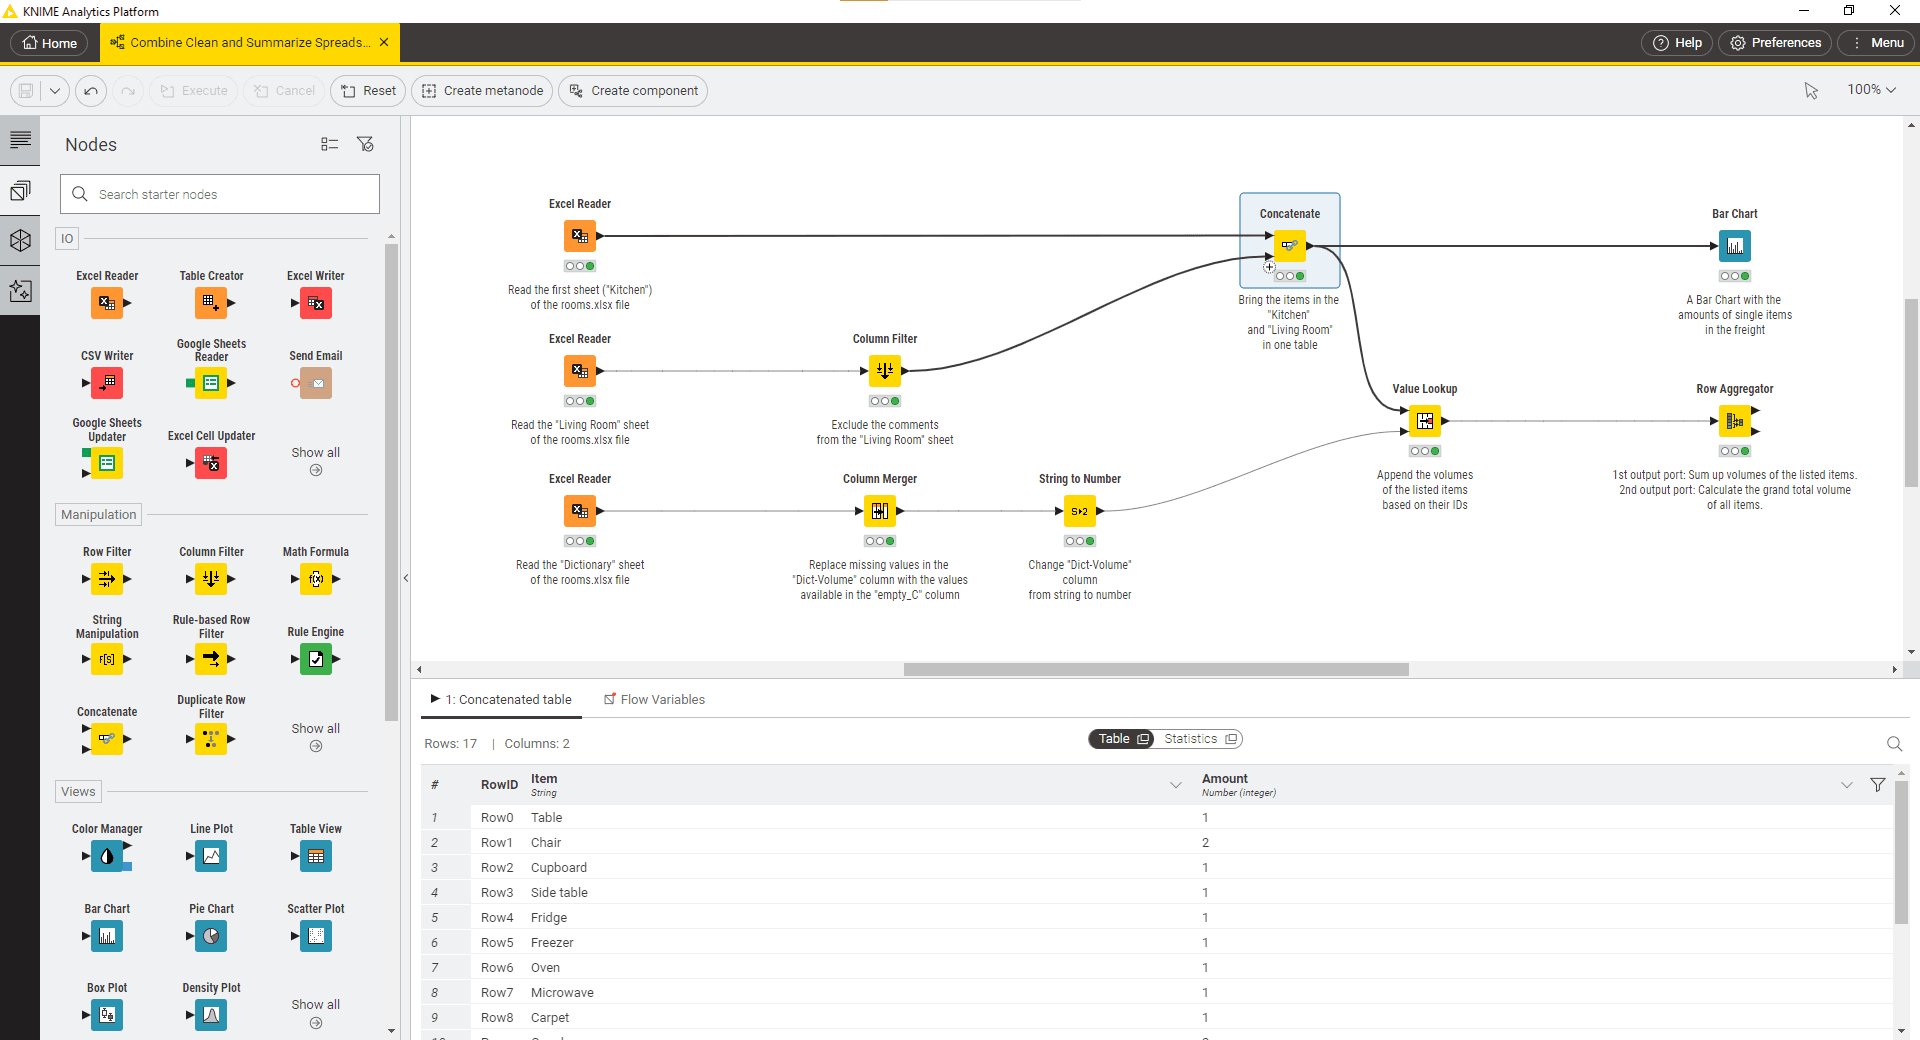
5. KNIME
KNIME is an open-source platform for data analytics, reporting, and integration. It allows users to visually design data workflows and apply machine learning, data mining, and statistical analysis techniques. It sits somewhere between a BI tool and a data science platform. More capable than most self-service tools but less powerful than a dedicated ML environment.
Key Features
Visual workflow design: Allows users to create data workflows using an intuitive drag-and-drop interface.
Extensive integrations: Connects seamlessly with R, Python, Hadoop, Spark, and other tools.
Built-in machine learning: Offers pre-built machine learning tools.
Data transformation and cleaning: Provides tools for cleaning, reshaping, and transforming data for analysis.
Python, R, SQL & Spark: Technical users can switch between visual workflows and code whenever needed.
Pros
Works with most existing stacks through its connector library.
Python, R, and extension support.
The free desktop version is functional. Small teams can build real workflows without paying.
Cons
Desktop performance is capped by local machine resources. Production workloads need Business Hub or equivalent.
Limited real-time analytics capabilities compared to cloud-native platforms.
Weak on real-time and streaming analytics. KNIME is built for batch and scheduled workflows.
6. Microsoft Azure Synapse Analytics
Microsoft Azure Synapse Analytics is a unified analytics platform that brings together big data and data warehousing. It's designed for teams that want to consolidate these functions, especially those already on Azure. Its integration with Power BI, Azure ML, and the rest of the Microsoft stack is the main reason to choose it.
For Microsoft-centric organizations, it's often the default. For others, it's usually evaluated against Snowflake and BigQuery.

Key Features
Integrated data warehousing: Combines on-demand and provisioned data processing.
Unified SQL and Spark: Supports SQL, Spark, and machine learning models in a single interface.
Data integration: Integrates with a wide range of data sources, both within and outside of Azure.
Real-time analytics: Processes real-time data streams for immediate insights and decision-making.
Built-in data pipelines : Based on Azure Data Factory, Synapse Pipelines let teams ingest, transform, and orchestrate data workflows at scale.
Pros
Combines data warehousing and big data analytics in one platform.
Fits naturally into Microsoft-heavy environments.
Flexible pricing with both serverless and provisioned options.
Cons
Initial setup and configuration can be challenging for new users or those unfamiliar with Azure
Costs can escalate with large-scale pipelines and storage.
The value case depends on being on Azure. Teams on AWS or GCP usually find better-fit alternatives elsewhere.
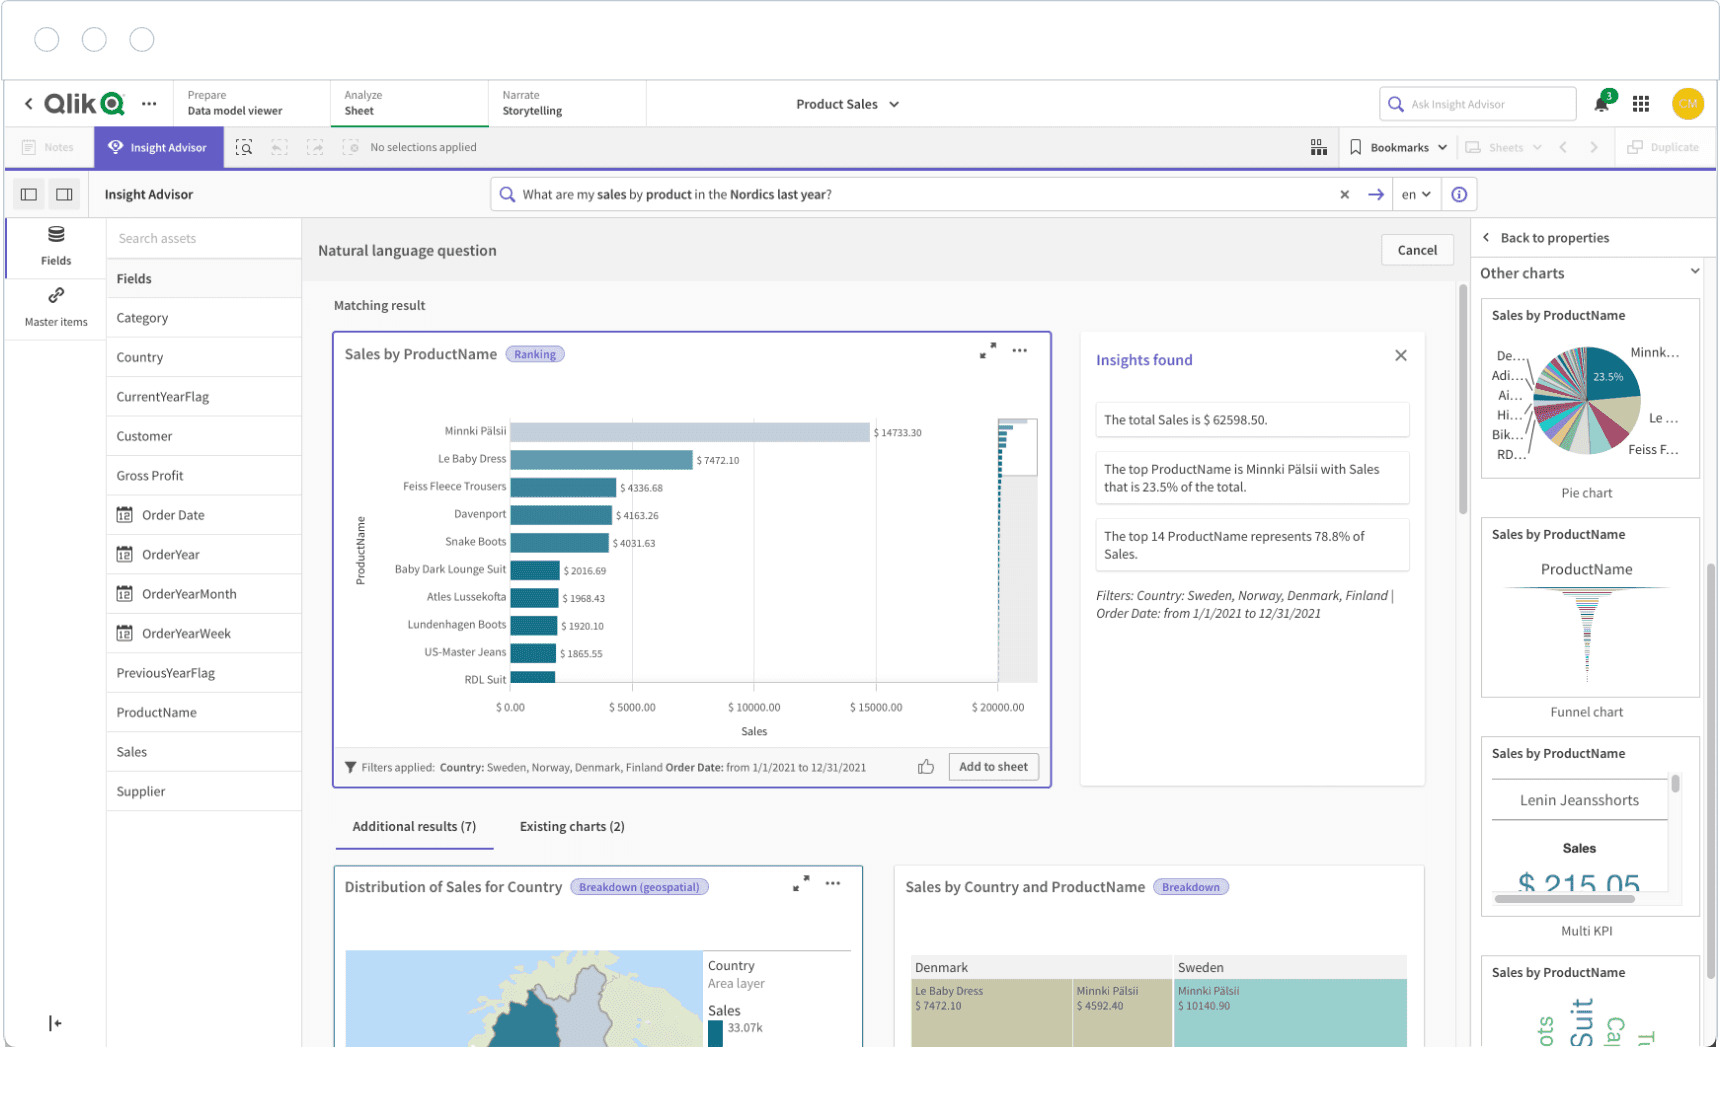
7. Qlik Sense
Qlik Sense is a self-service data analytics platform built around an associative data engine. Instead of predefined joins or query paths, the engine lets users explore relationships across fields without writing queries. It's a different approach from most BI tools, and it's been Qlik's main differentiator for a long time.
It sits in the same consumption-layer space as Tableau and Power BI, with a more exploratory interaction model.
Key Features
Associative data model: Allows users to explore data freely without being limited to predefined queries.
Self-service visualization: Build dashboards without code.
Advanced analytics integration: Supports integration with R and Python for advanced statistical analysis.
Real-time data insights: Provides real-time access to data, enabling quick decision-making.
Smart search across all data: A Google-like search bar allows users to type keywords and surface relevant data points, metrics, and visualizations.
Pros
The associative data model makes exploring data easy and intuitive.
Supports integration with R and Python for in-depth analytics.
Works well in hybrid environments, supporting on-premise and cloud deployments.
Cons
Initial setup and deployment can be complex, especially for larger organizations.
Visualizations feel dated compared to newer BI tools.
Data modeling can feel complex compared to tools with simpler, SQL-first workflows.
Get trustworthy insights from your data
Most big data analytics tools aren't bad. They just weren't built for the problem most teams have now. Scaling data was the old challenge. Getting trustworthy answers fast enough to act on is the new one.
That's the gap WisdomAI closes. You can simply ask questions in natural language and get answers grounded in your business logic, auditable back to the source. Analysts stop being the bottleneck. Dashboards stop being the ceiling.
Request a demo today and close the gap between your data and your decisions.