Guide
Self-Service Analytics Tools: 2026 Buyer's Guide
Self-service analytics had a pretty low bar for a long time. If your marketing lead could build a dashboard without filing a Jira ticket, that was a win.
But charts aren't answers. The second someone asks "why," they're back in the analyst queue, waiting on the same data team the tool was supposed to stop burdening.
That's starting to change. The best self-service analytics tools now let you ask something like "Which deals are most likely to slip this quarter, and why?" and actually get something you can walk into a meeting with. Sourced, in context, ready to go.
This guide is about the tools that broke the mold. Fair warning: it's a short list.
7 best self-service analytics tools at a glance
Platform | Best for | Ease of use | AI features | Pricing |
WisdomAI | Agentic analytics across structured and unstructured data. | Ask questions in plain language and get trusted, verifiable answers. | Analytics Agents that monitor metrics, answer complex queries, and surface insights proactively. | Custom pricing |
Zoho Analytics | Budget-friendly BI for the Zoho ecosystem | Drag-and-drop interface for visualization. | Zia AI handles natural language queries. | From $25/user/month |
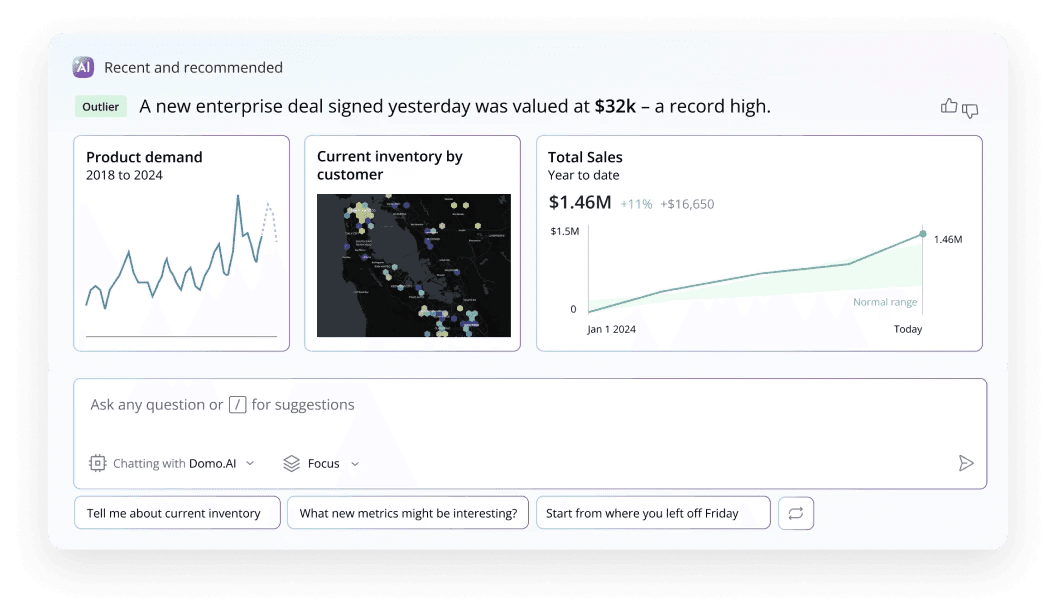
Domo | Centralizing data from multiple sources. | No-code Magic ETL and drag-and-drop visualizations. | AI-assisted insights. | Consumption-based (contact sales). |
Metabase | Open-source BI with no vendor lock-in. | Visual query builder for automated charts. | Metabot AI for natural language querying. | Cloud plan starts from $106/user/month |
ThoughtSpot | Search-based analytics for cloud-based warehouses. | Type questions, get charts. | Spotter AI for detecting trends and anomalies. | From $25/user/ month |
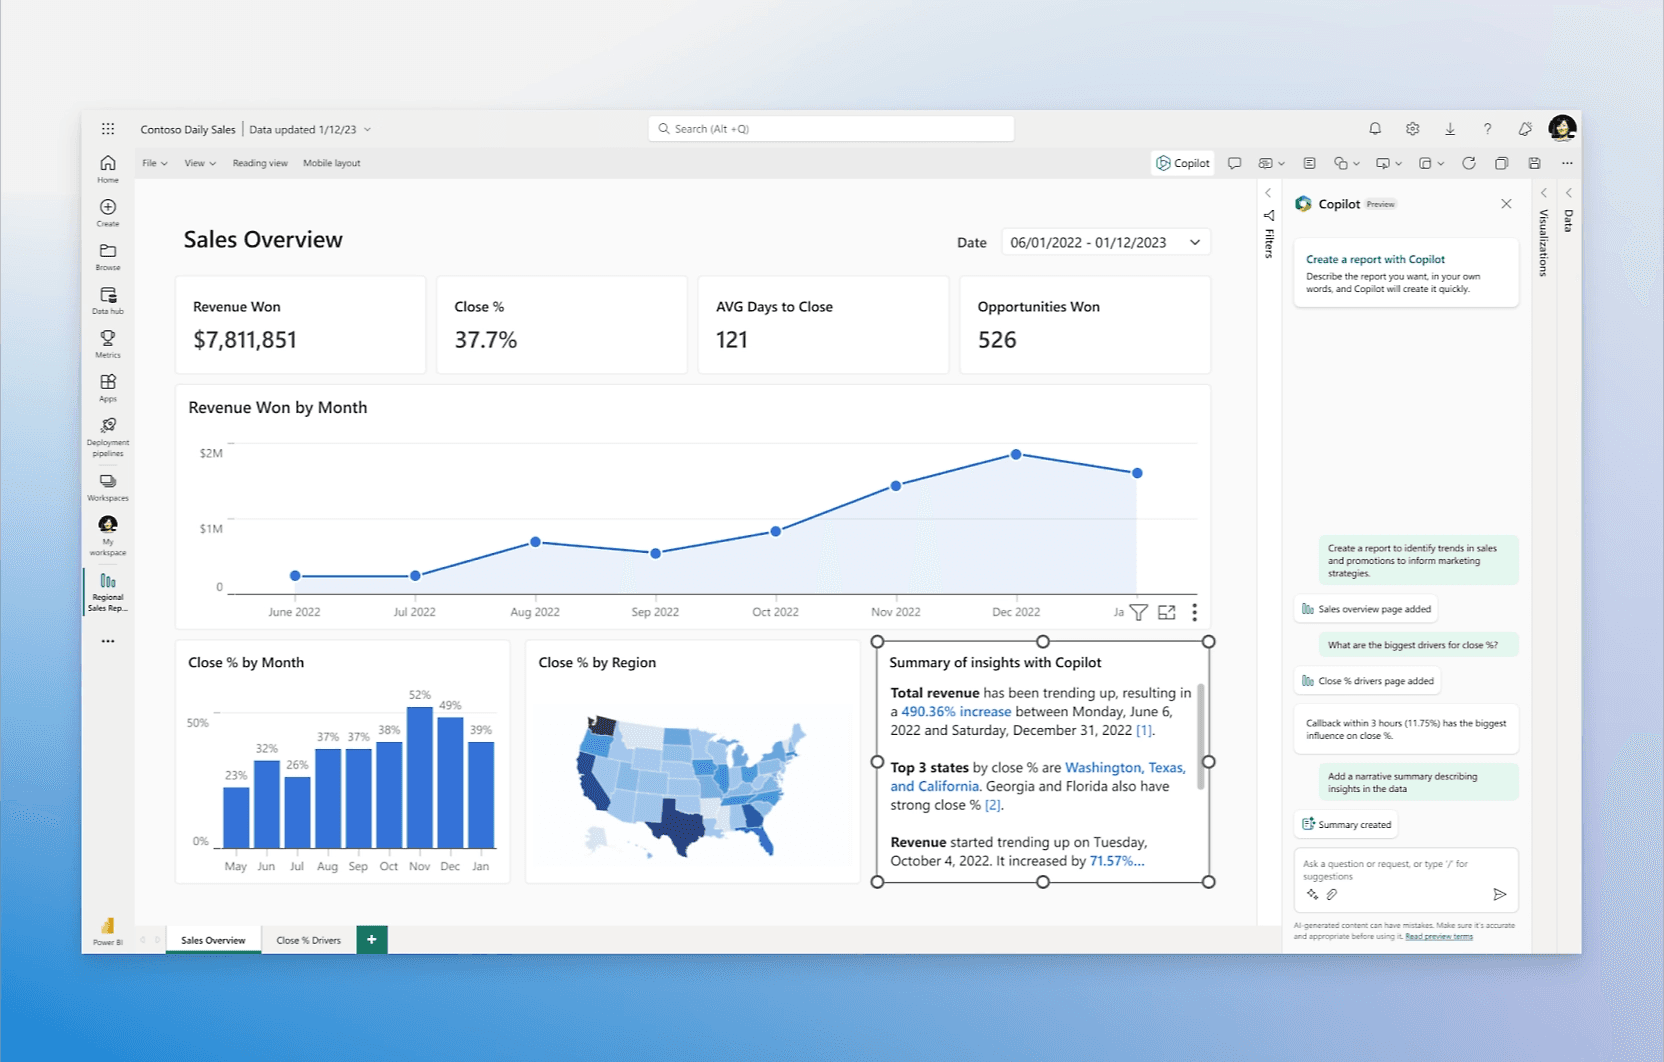
Power BI | Microsoft shops that want affordable BI. | Drag-and-drop dashboards and visualizations. | Copilot for natural language (Premium tier only) | From $14/user/month |
Tableau | Visual data exploration. | Drag-and-drop dashboards with custom options. | Tableau Agent for natural language querying. (Premium tier only) | From $15/user/month |
Here's the deeper dive into each tool. For more details, jump to our full BI comparison guide.
1. WisdomAI: Best for complex multi-step analysis
Most self-service tools lock you into a single loop: ask a question, get a chart, move on. WisdomAI doesn't stop at charts.
Analytics Agents work through questions the way an experienced analyst would. Ask "Compare sales to last quarter, accounts under $100K ARR only," and you get the breakdown with the filters already applied. Follow up with "Now build me a dashboard by region," and it builds one without losing the thread of the conversation. The agent holds context across every step, plans its own approach, and adjusts when the underlying data shifts.
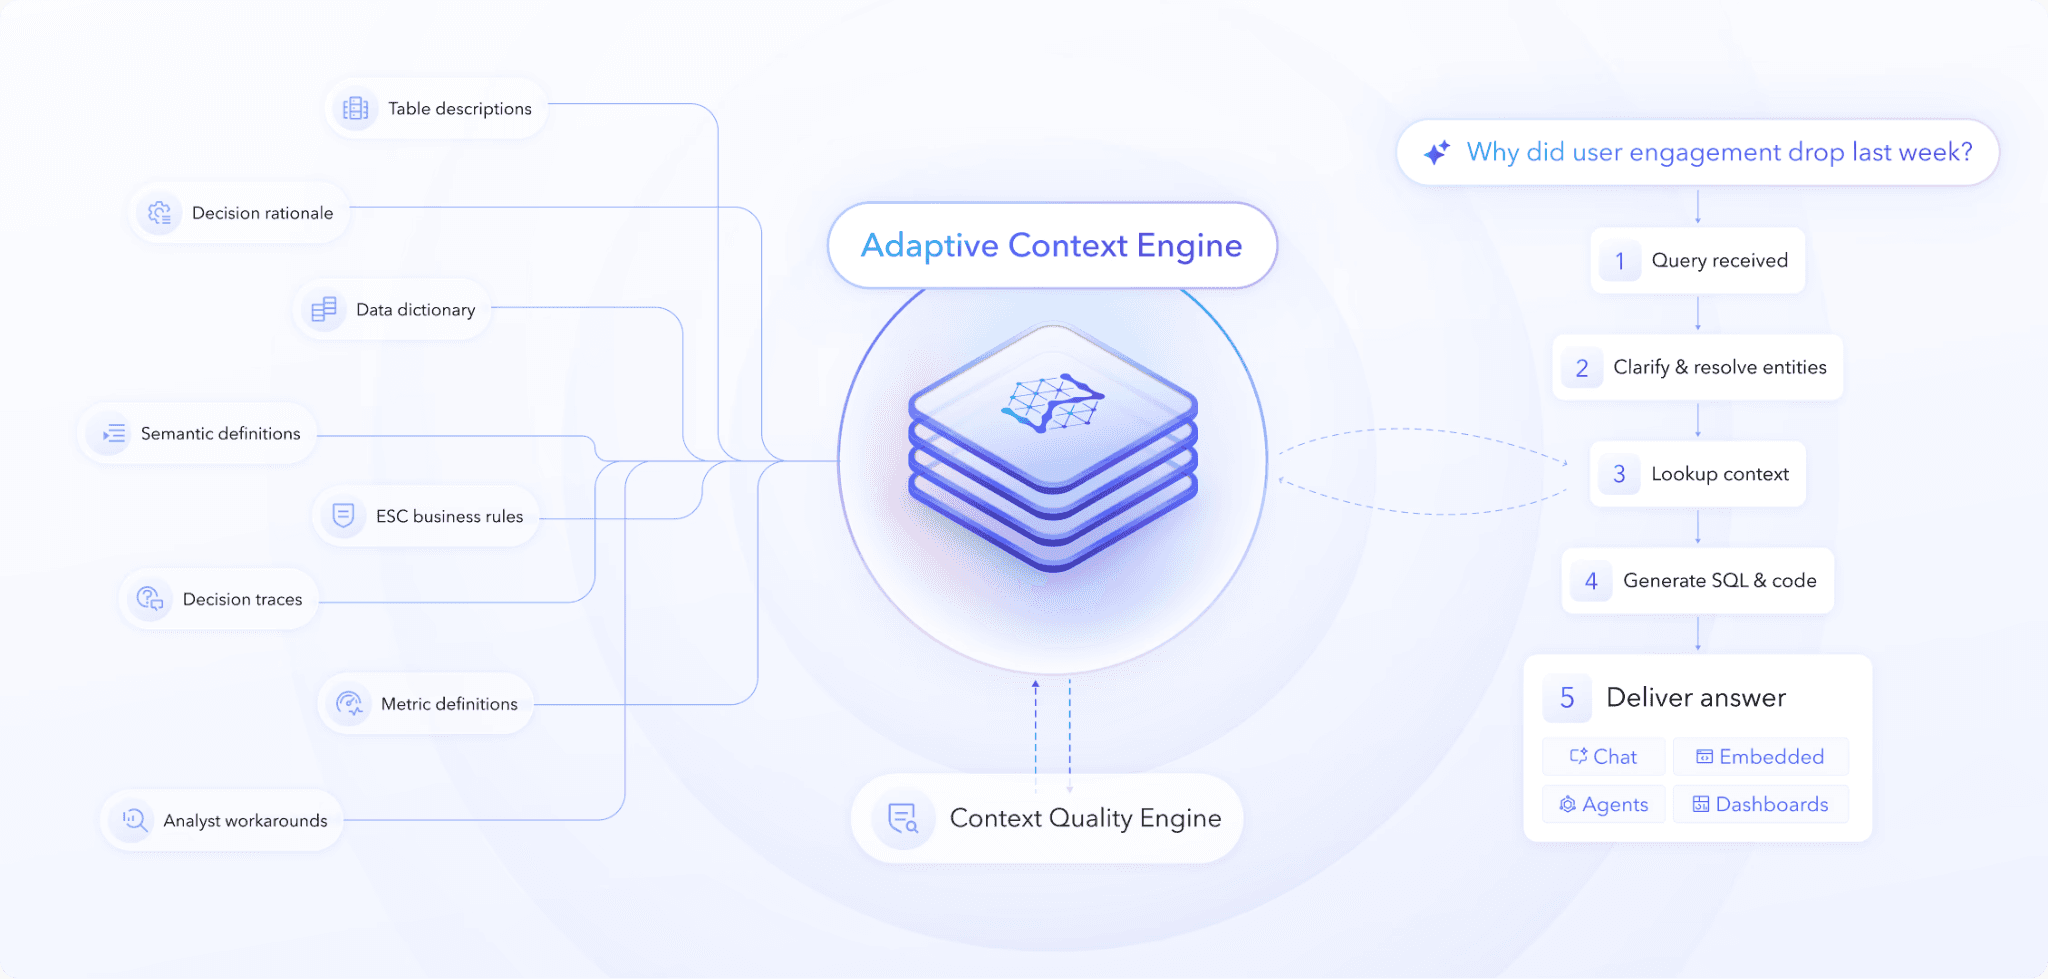
The Adaptive Context Engine is what makes those answers trustworthy. You encode your business logic once: metric definitions, permission boundaries, and how your team actually thinks about the data. The system learns from there. Every interaction sharpens the context, so answers get more accurate over time.
Key Features
Conversational BI: Ask complex questions in plain language and get auditable answers, no waiting for analysts.
Analyst Agents: Analyze data, detect anomalies, and alert your team before problems escalate.
Adaptive Context Engine: Every answer is grounded in your business definitions and rules, so metrics are consistent and defensible.
AI dashboards: Generate rich data visualizations, drill infinitely, and get AI-powered summaries of what changed and why.
Federated data sources: Works across multiple data types, including structured, unstructured, and semi-structured, without moving your data.
Pros
Analyst-level analysis, without an analyst.
Non-technical users can handle complex workflows independently.
Handles all data types, not just clean tables.
AI answers are grounded in your business logic.
Cons
Custom pricing requires a sales conversation.
A relatively new player in this category.
2. Zoho Analytics: Good for reporting
Zoho Analytics is the budget pick. It connects to diverse data sources and integrates tightly with the Zoho suite. The drag-and-drop interface is straightforward, and Zia (the AI assistant) handles natural language queries efficiently.
If you're already using Zoho CRM, the integration might make it worth a look. The AI features are shallow, though. Ask "Why did churn increase last quarter?" and you get a summary, not root-cause analysis. The platform doesn't support robust query engines, so you hit a ceiling fast with complex questions.
Key Features
AI-assisted insights: Natural language querying with Zia.
Intuitive interface: Drag-and-drop report and dashboard builder.
Data preparation: Cleansing and preparation across multiple sources.
Instant alerts: Instant notifications when metrics deviate from baseline.
Pros
Drag-and-drop functionality for crafting charts.
Cheapest entry point for teams already in the Zoho ecosystem.
Filtration for reports and dashboards.
Cons
AI capabilities are shallow.
Limited query engine support for complex analysis.
Customization options lag behind competitors.
3. Domo: Good for data centralization
Most teams have data scattered across SaaS apps, cloud warehouses, and on-premise systems. Domo's strength is pulling all of it into a single, real-time layer. Magic ETL lets non-technical users build pipelines without code, and the platform generates visualizations.
The tradeoff: Domo's good with structured data. Complex reasoning or unstructured data analysis? You'll hit a wall fast. And the pricing model is consumption-based, which means unpredictability—your bill depends on how many queries your team runs, not just the number of users.
Key Features
Data transformation: Magic ETL for no-code pipeline building.
App builder: Low-code tools for custom data-driven applications.
Connectors: Prebuilt connections for SaaS, cloud, and on-premise sources.
AI assistant: Natural language querying and insights generation.
Pros
An extensive connector library covers most data sources.
Real-time data updates and interactive visualizations.
Straightforward interface for monitoring metrics and analyzing trends.
Cons
The AI layer is limited in its ability to perform complex reasoning.
Consumption-based pricing is unpredictable.
Sometimes overly complex for simple use cases.
4. Metabase: Good for open-source BI
Metabase is the open-source pick. Deploy it on your own infrastructure with no licensing costs. You get a visual query builder and an SQL editor, so you can start simple and go as complex as you like. It's developer-friendly with a straightforward setup.
The catch is scope. Beyond basic dashboards, if you need dense reports with calculated rows and complex data blending, the platform struggles. There's no built-in AI either—it comes with a chatbot that only shows basic metric changes, not real analysis.
And while the open-source version is free, most advanced features are locked behind paid tiers, which feels like a steep jump from free to enterprise pricing. Metabase is a starting point for exploration, not an enterprise BI solution.
Key Features
Query builder: No-code visual builder for business users.
Advanced queries: SQL editor for complex analysis.
Reporting: Send scheduled reports via email or Slack.
Deployment: Open-source with a free self-hosted option.
Pros
Developer-friendly setup and maintenance.
Fast to deploy and get running.
No vendor lock-in—you own your data and infrastructure.
Cons
Limited visualization and chart options.
No powerful AI capabilities.
Performance issues with large datasets.
5. Thoughtspot: Good for search-driven analysis
ThoughtSpot is built around search-driven analytics. You type a question and Spotter, its AI assistant, returns visualizations and insights. Spotter can also handle follow-up questions and compare time periods or segments without you having to rephrase everything.
The issue is trust. Spotter answers basic questions, but without a broader context layer, you're vulnerable to hallucinations. ThoughtSpot has a semantic layer that keeps queries consistent, but it doesn't prevent Spotter from hallucinating. You also need structured data for analysis, which adds cost and complexity.
Key Features
Search interface: Natural language search across your business data.
AI assistant: Spotter for automatic trend analysis and anomaly detection.
Dashboards: Real-time dashboards that update automatically.
Conversational: Follow-up context remains throughout the conversation.
Pros
Intuitive search-driven interface.
Spotter surfaces trends and anomalies.
Good natural language querying experience.
Cons
Requires a cloud data warehouse as a prerequisite. Support for third-party sources is limited.
Reactive, not proactive monitoring.
Limited unstructured data support.
6. Power BI: Good fit for Microsoft teams
Power BI is Microsoft's BI platform. If your organization runs on Office 365 or Azure, it's the natural choice. Copilot can generate reports, summarize dashboards, and answer questions in natural language. The drag-and-drop interface is intuitive for building dashboards.
The real limitation is DAX, Power BI's data modeling language. Simple dashboards are easy to build, but anything beyond that requires learning DAX—and that's where most analyses die. For genuine self-service analytics across your organization, everyone needs to learn DAX, which limits the extent to which true self-service can go.
Key Features
Data ingestion: Connections to diverse sources with Power Query transformation.
Data modeling: DAX language for advanced calculations.
AI assistant: Copilot for natural language insights.
Interface: Drag-and-drop dashboards and visualizations.
Pros
Deep Microsoft ecosystem integration.
Supports advanced analytics use cases such as data modeling.
Multiple visualization options for business reporting.
Cons
AI features are locked behind premium tiers.
DAX learning curve limits true self-service.
Performance issues with large datasets.
7. Tableau: Good for visual exploration
Tableau set the standard for data visualization. The drag-and-drop interface is intuitive, and recent additions include Tableau Agent for natural-language querying and proactive KPI monitoring.
The core dashboarding is excellent. But the cost is steep. Getting the full self-service experience requires Tableau+ pricing along with creator licenses. At this point, you're spending significantly more compared to purpose-built self-service analytics tools. The AI features are also limited. You get basic natural language querying, but don't expect deep analysis or complex reasoning.
Key Features
Interface: Drag-and-drop building for charts, maps, and dashboards.
Data prep: Tableau Prep for visual cleaning and shaping.
Monitoring: Proactive metric monitoring for reports and dashboards.
AI assistant: Tableau Agent for natural language querying.
Pros
Intuitive drag-and-drop interface for building dashboards quickly.
Robust data blending capabilities for combining multiple data sources.
Proactive KPI monitoring.
Cons
Limited AI capabilities beyond basic NLP.
Performance slows with large datasets, causing significant lag.
Premium features require Tableau+ licensing, which creates fragmented pricing.
Why trust is the evaluation factor most organizations miss
Every vendor today claims to have an "agentic" or "AI-powered" solution. When most organizations evaluate these tools, they gravitate toward the obvious questions:
How fast is it?
How many data sources does it connect to?
How sophisticated are the visualizations?
How impressive is the demo?
Does the platform have an agentic workflow?
These are reasonable questions, but they can point you in the wrong direction. Speed, connectors, or a polished demo don't matter if you can't trust the answer. A dashboard built on the wrong metric definition is still wrong.
Most vendors respond to this concern with "explainability." They show you how the agent arrived at the answer. You can see the query it ran, the data it used. That sounds reassuring, but it's backward. You're still verifying after the fact. The agent guessed, and now you're auditing the trail.
WisdomAI's Adaptive Context Engine works differently. You codify your business logic upfront: pre-approved metric definitions, permission boundaries, data lineage, cross-source relationships. The agents start from that foundation every time they answer a question. They're not generating an answer and trying to justify it afterward. The context is governed before the agent ever gets involved.
Before you shortlist anything, ask two questions: Does the tool codify your business logic, and can it keep up as those definitions evolve? AI is only as useful as the context it's grounded in.
Without governed definitions, permission boundaries, and source-of-truth hierarchies, you don't have self-service analytics. You have self-service liability.
Trust and speed are the new foundation
The promise of self-service analytics was always simple: business users get answers without waiting on the data team. Most tools got you halfway there. You could build charts, but the hard questions still ended up in the analyst queue.
WisdomAI was built for the other half. It works with messy, unstructured data, understands questions in plain language, and returns answers grounded in your business logic. Together, these deliver what self-service was supposed to be from the start.
See it in action. Book a demo today.