
The case for white label analytics: Is it worth investing in?
What is white label analytics, and how is it different from standard embedded analytics?
What are the four pillars of a native-feeling analytics experience?
Why does owning the full experience drive brand trust, adoption, and new revenue?
Which embedding method is right for your product: iframes, components, SDKs, or APIs?
PUBLISHED:
UPDATED:
Remember the first wave of support chatbots? They were everywhere, and honestly, they were frustrating. You’d ask a simple question and get a wall of useless help articles. Or worse, it would ask for an order number that was already sitting right there on your screen. They failed because they lived inside the product without ever actually being part of it.
That's the cost of bolting something on. You can drop the best AI dashboards inside your product, but if they don't share your data, business logic, or brand design, your customers will feel the friction.
Your reporting has to inherit all three. That is exactly what white-label analytics does: it delivers a fully branded data experience that feels native to your product.
What is white label analytics?
White label analytics is the practice of embedding custom data and reporting capabilities directly inside your product. Your customers get dashboards, visualizations, and conversational BI right where they work, while you retain full control over the branding, navigation, and the overall experience.
Best of all, you don't have to build any of it from scratch. An embedded analytics platform gives you the tools to set the fonts, colors, layouts, and logos to match your UI, and the vendor maintains the query engine and infrastructure underneath. What you ship is analytics that looks fully native and reaches customers in weeks — not the quarters it would require for a custom build.
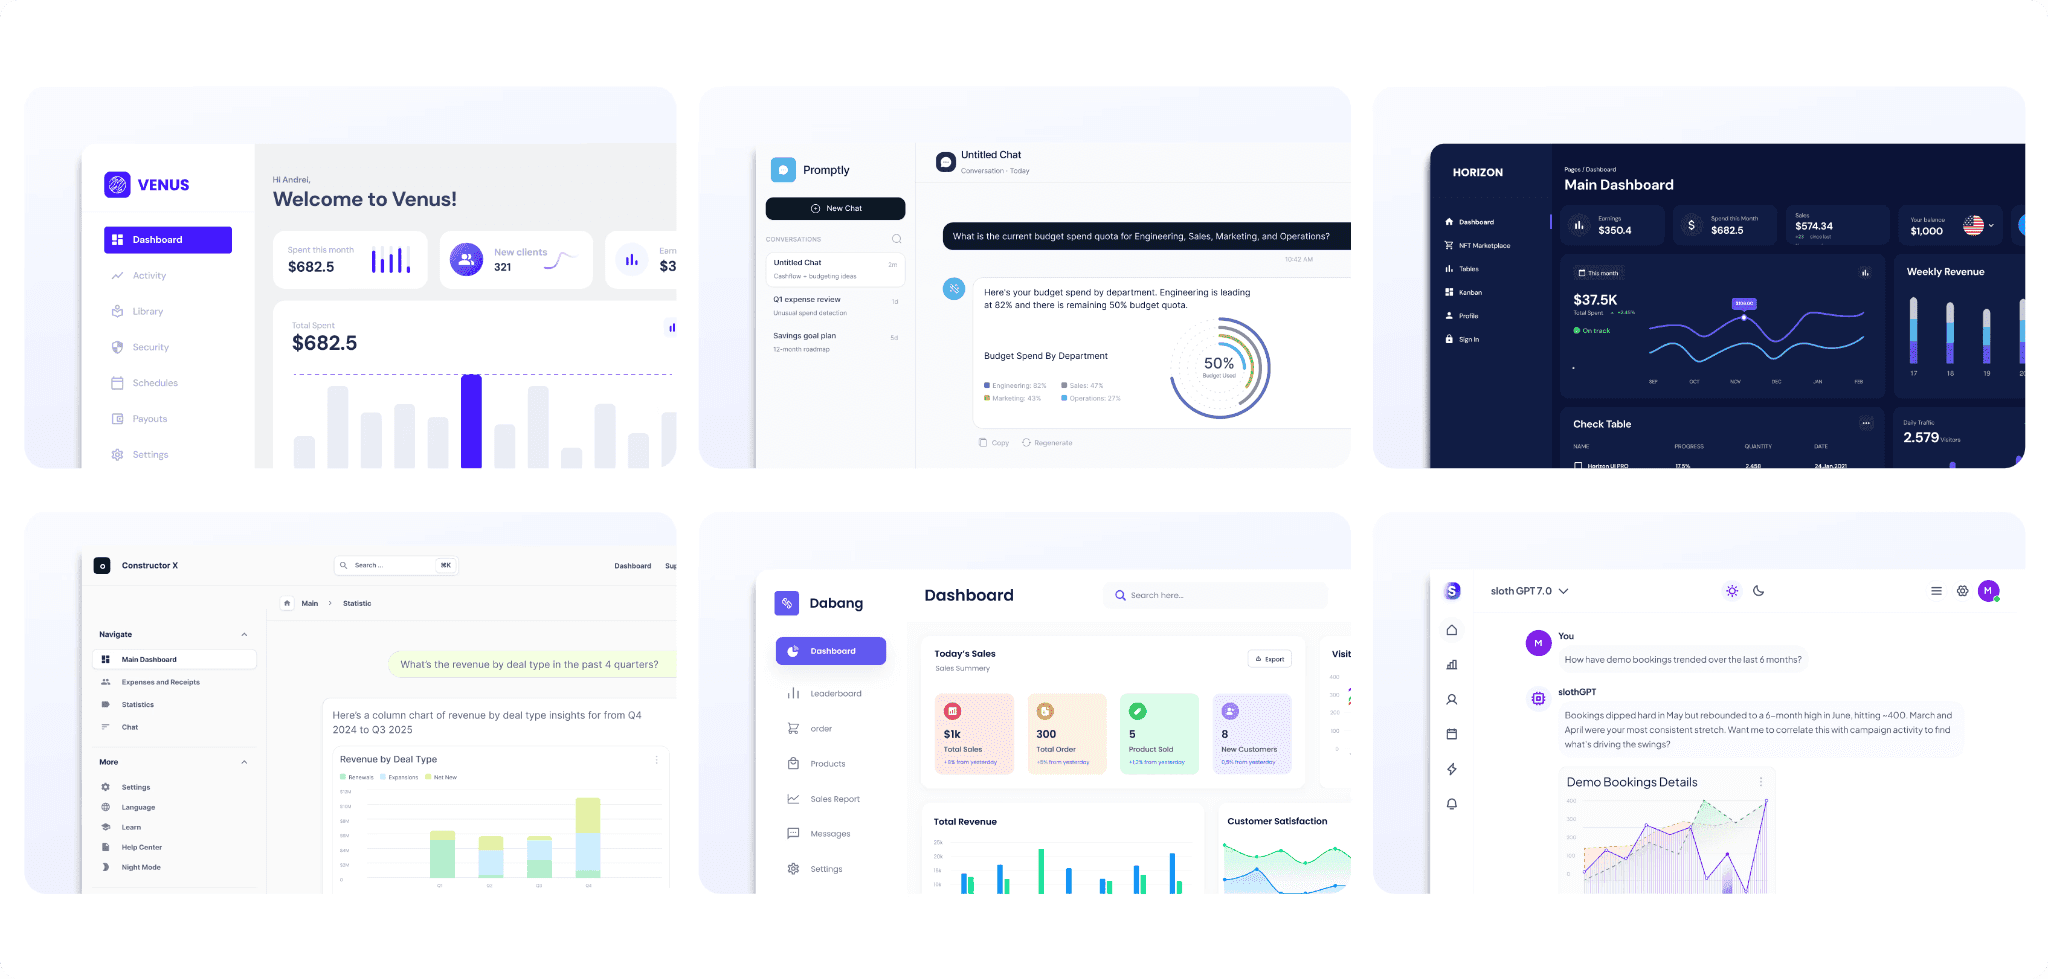
Embedded analytics vs white label analytics
Every white label implementation is embedded, but not every embedded integration is white labeled.
The confusion usually comes down to customization. Embedded analytics does offer a baseline of brand control — you can tweak primary colors or add basic layouts so the dashboards sit nicely inside your app. White label analytics closes the rest of the distance. You set your fonts, your domain, and your metric names, until nothing on the screen suggests anyone else was involved.
Here is exactly how to draw the line:
Embedded analytics | White label analytics | |
What it covers | Placing dashboards and reporting inside your application. | Extending your brand and vocabulary across that experience. |
What you configure | Where analytics sits in your app, what data each user can read, and how it loads. | Logos, fonts, colors, custom domain, metric names, and other branding components. |
What level of control do you get | You control the data pipelines, user access, and embedding logic. | Every surface the customer sees, down to error messages and empty states. |
Who owns the build | Product and engineering | Design and brand |
What makes up for a good white label analytics experience?
The next step is to determine what actually makes for a great analytics experience — rather than an afterthought. Spoiler: it’s way more than just slapping your logo on a dashboard.
To get it right, you have to nail these four pillars:
Brand identity
Your logo, fonts, colors, and product vocabulary must apply consistently across every surface the customer touches. While styling a dashboard is easy, teams constantly overlook the assets that leave the platform. Exported PDFs, scheduled emails, and shared links — all have to carry the same branding.
Multi-modal experience
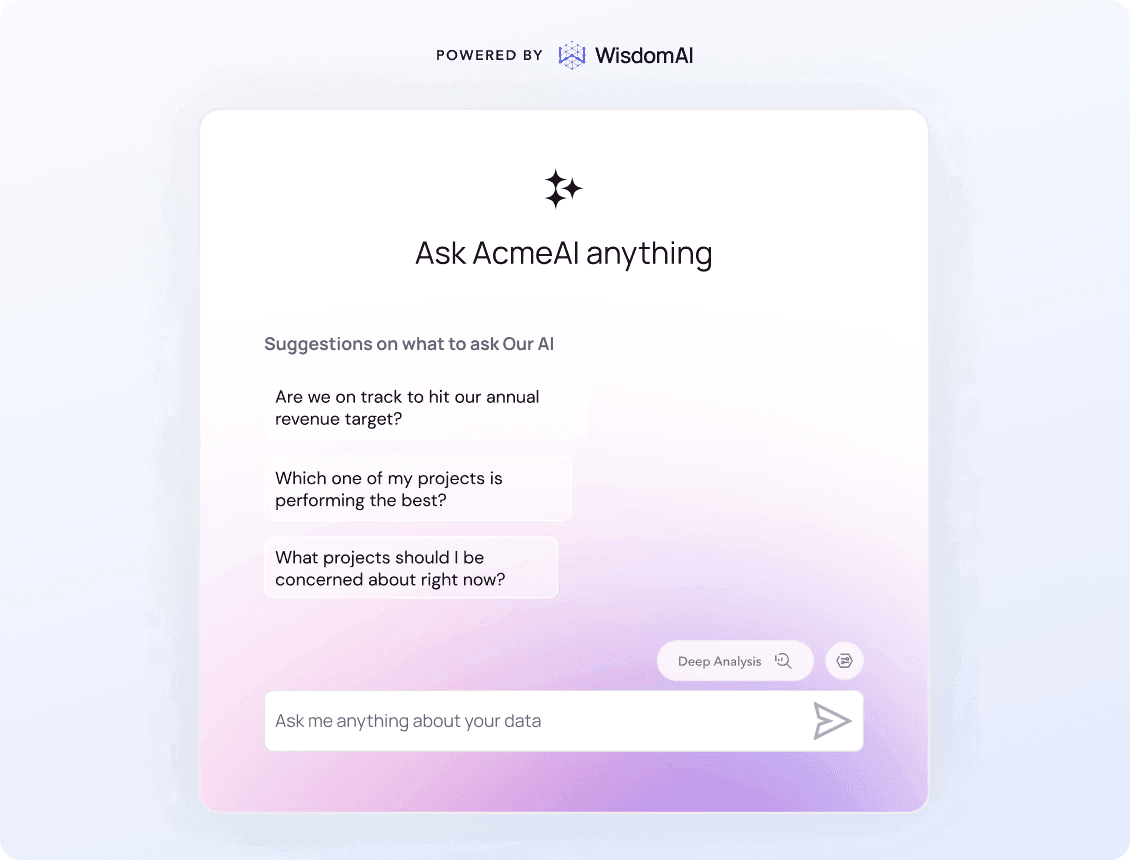
The next generation of BI isn't a single interface. It's a mix of different AI-powered capabilities working together, which includes AI-augmented dashboards, Conversational BI, and Analytics Agents that surface the insights that matter most to your customers.
Your customers also want to explore data differently at different times. Sometimes they're scanning a chart, and sometimes they're typing a question in plain English. But most of the time they just want a quick AI summary of the metrics that matter most. A great white label experience meets them in each of these modes at any point in your product, without making them switch tools, relearn the interface, or wonder which answer to trust.
Accuracy and reliability
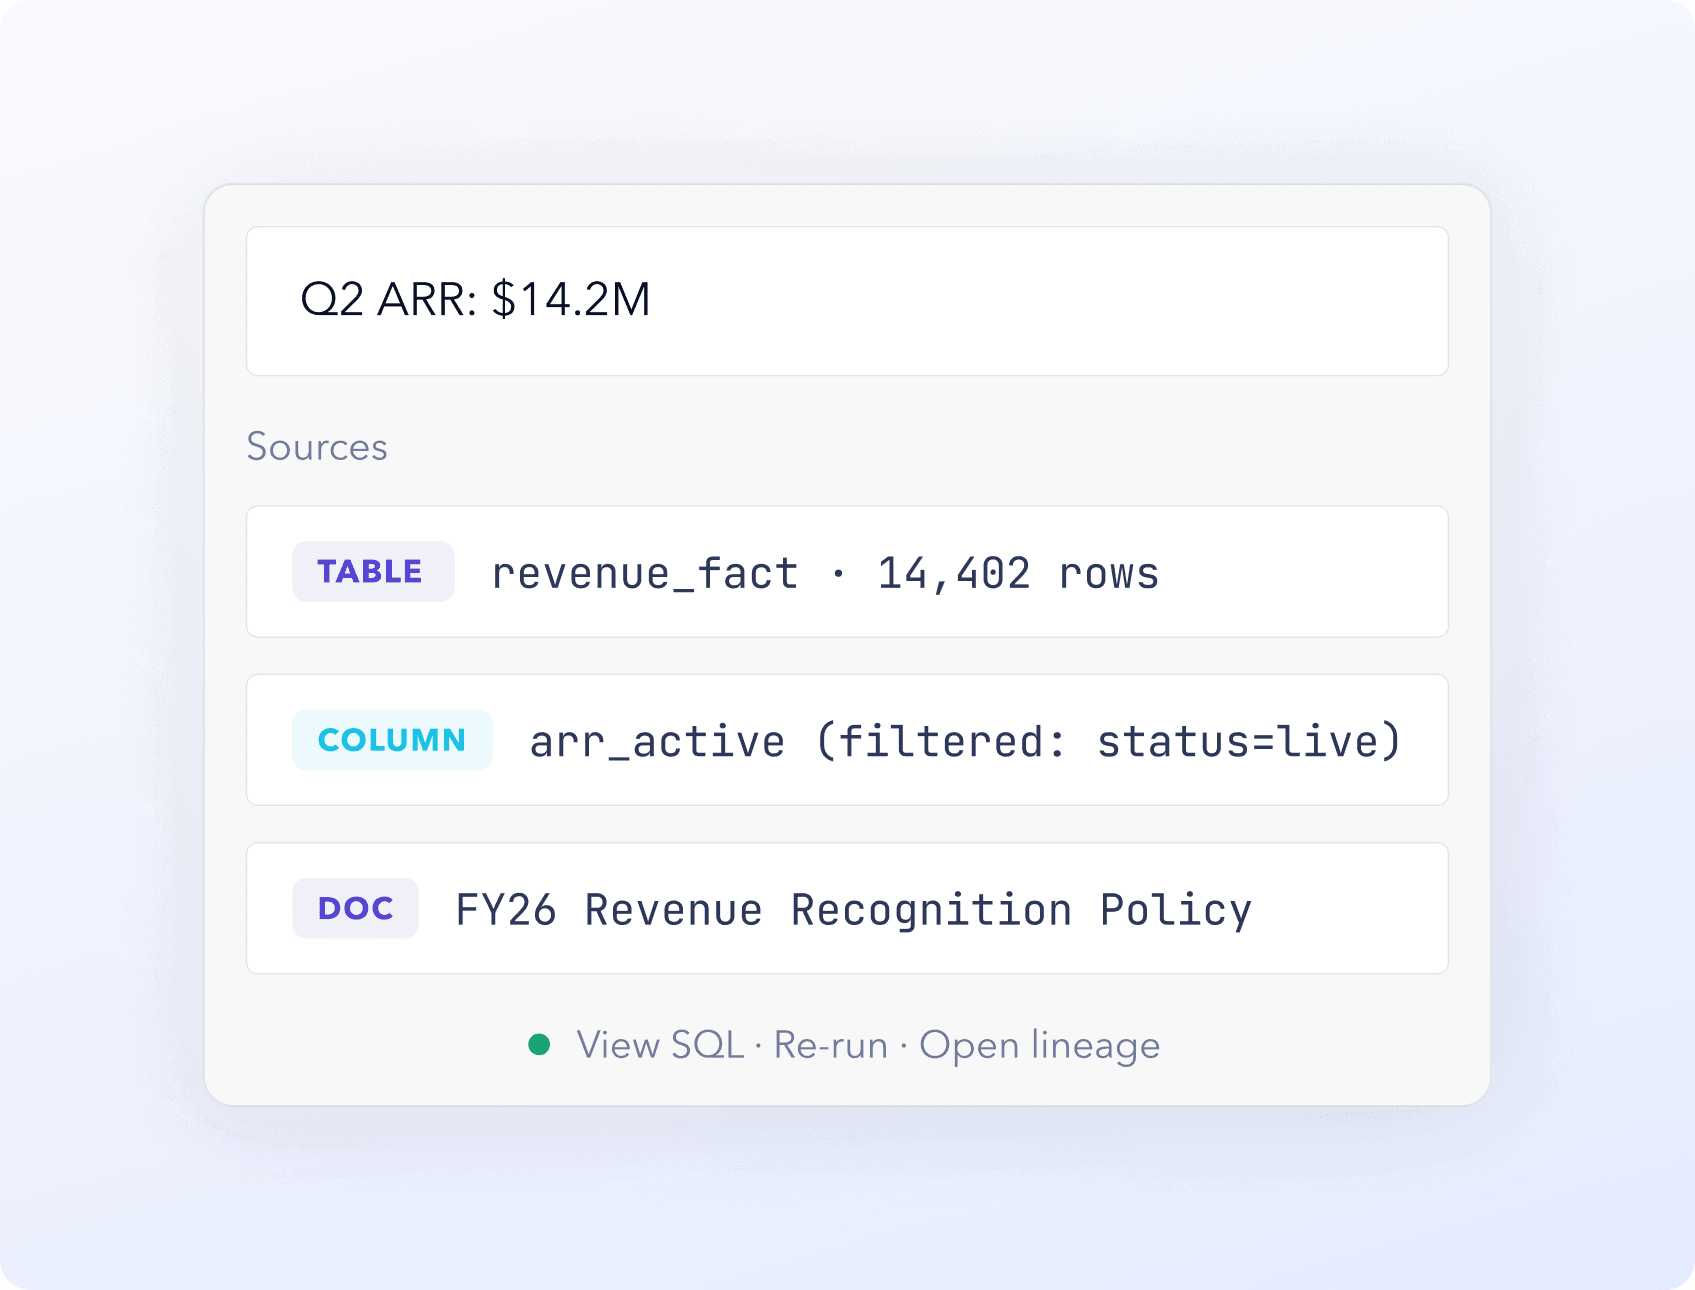
Visual consistency only gets you halfway. When AI is involved in the analytics experience, you need enterprise context to ensure answers are accurate. When the context layer isn't maintained, definitions drift, and customers get answers they can't rely on. You and your vendor also have to agree on who will build and maintain the context infrastructure underneath.
Navigation that matches your product
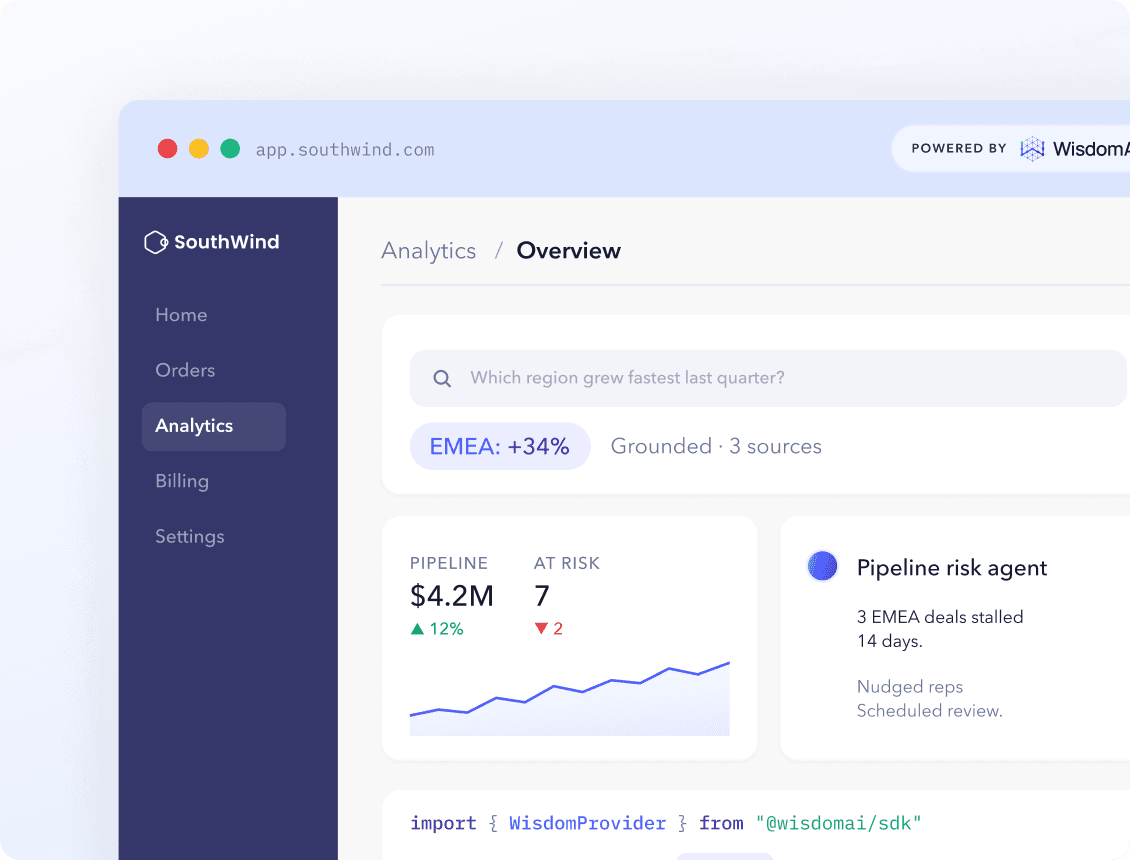
Customers should be able to move through their analytics exactly the way they move through your UX. That means identical labels, familiar filter behaviors, and a back button that actually works as expected. If the navigation breaks convention, the logic of your app breaks with it, and customers won’t be able to intuitively filter their metrics or drill into the underlying data.
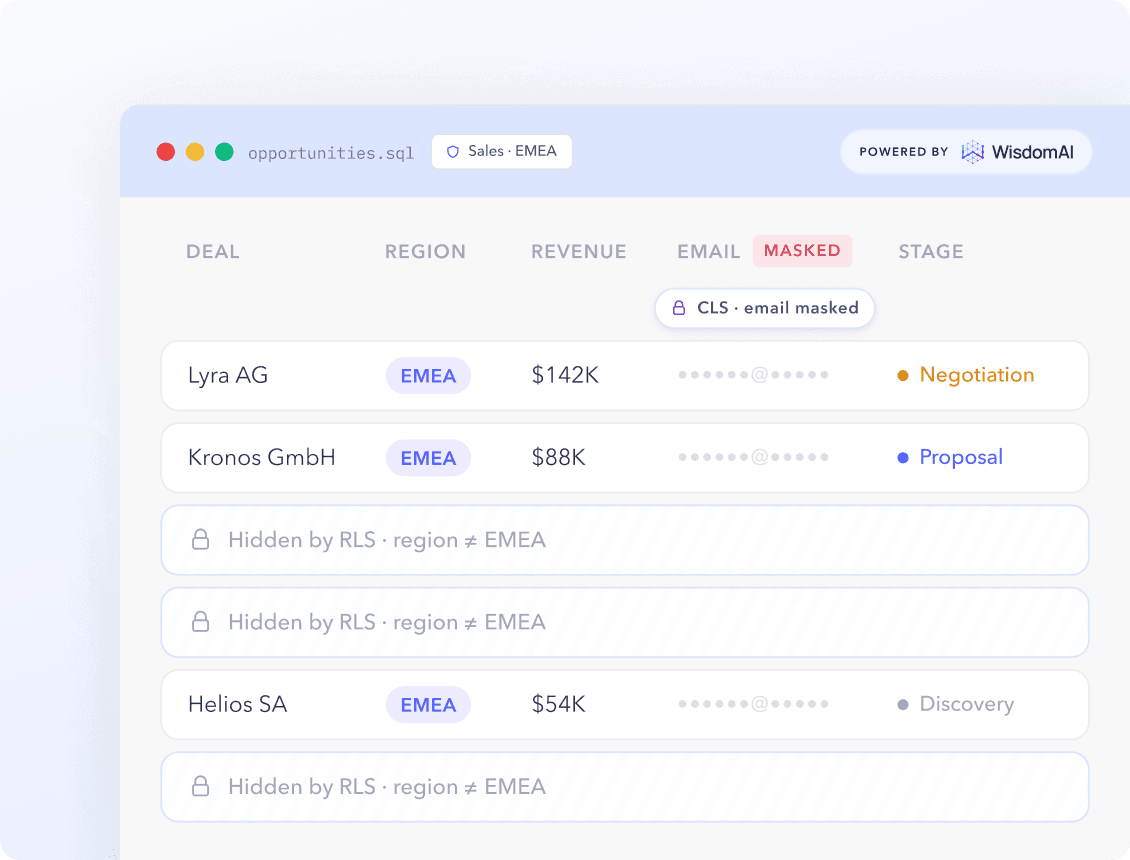
Security that holds at the data layer
In a multi-tenant product, access controls must be enforced where the data sits, not just at the visualization layer. If your security stops at the dashboard, you're essentially turning direct queries into open doors between tenants. And as we all know, one cross-tenant leak is enough to ruin a customer relationship.
The strategic value of white label analytics
Stronger brand consistency
When a dashboard loads an off-brand font, metrics use unfamiliar names, or a scheduled report arrives from a vendor's email address, the message to your customer is clear: this wasn't built for you. That inconsistency creates friction. After breaking the promise of a unified experience, users will project that unease onto the rest of your product.
White label analytics keeps the experience consistent across all surfaces. It inherits your design system, speaks your product's vocabulary, and sends reports directly from your domain. Customers move between their core workflow and their data without ever registering a transition.
Faster time to market
Forcing a vendor's analytics to look native is an uphill battle most platforms aren’t designed for. Your team can burn weeks hacking stylesheets, replacing fonts, and fighting a restrictive theming API. Embedding a basic dashboard might take days, but building a version you're actually proud to show customers can easily take quarters. Even worse, that experience is subject to shift every time the vendor pushes an update.
A purpose-built white label platform changes the math completely. Instead of relying on messy workarounds, you can use flexible tools like iframes and SDKs to customize every component. This allows you to ship native-feeling analytics in weeks, and it gives your engineering team back time to focus on the work that actually makes your product unique.
Stronger adoption
An analytics layer that arrives with its own navigational structure, terminology, and login screen is essentially a second product your customers have to learn. Most of them won't. They will go back to exporting a CSV.
White-labeling removes those learning curves. Your customers open a tab they already understand and find metrics under names they already use. Usage compounds from there. Saved views pile up, dashboards get shared in team meetings, and your product becomes an essential part of the workflow, not a red line on a budget sheet.
New revenue potential
If your product generates valuable data, your customers are likely analyzing it somewhere else. Right now, they are exporting CSVs, loading them into external tools, and paying a monthly fee for that seat. The demand exists, but another vendor is monetizing it.
That is your opening for a paid tier. By placing conversational BI, scheduled reports, and advanced exports behind a premium plan, you capture that value directly. However, customers won't pay a premium for a disjointed, third-party dashboard. White-labeling the experience is what makes the upgrade feel native and truly sellable.
How to white label analytics inside your app
There are four main ways to customize the analytics layer inside your app. Each method offers a different degree of control over the user experience, and where you land depends entirely on how central analytics is to your core product.
Themed iframes
This is the fastest route to getting something live. You can point an iframe at a vendor-hosted dashboard and apply basic theme options, which include encoding your colors, fonts, and logos. Nothing in your codebase changes, and you can ship a first version in days.
However, that speed comes with a tradeoff. Since you are limited to the vendor's underlying theme, the primary surfaces will match your product, but you may encounter inconsistencies around edge cases. Error states, empty states, and export headers are the most common gaps.
Web components
In this method, the vendor ships charts, filters, dashboards, and chat modules as custom HTML tags. You place these components directly into your own layout, which lets you control the surrounding navigation, headers, and spacing.
This is when analytics finally stops feeling like a third-party tool and becomes a part of your design system. The components inherit your CSS, so a change to your typography reaches the analytics the same way it reaches everything else. Ultimately, the vendor's identity just completely disappears into the markup.
Developer SDKs
By installing the vendor's package, usually React, Angular, or Vue, your team gains programmatic control over how every chart looks, behaves, and responds to data. You're no longer inheriting styles. You design each component to feel like a natural extension of your product.
The tradeoff is engineering time. Without default layouts to fall back on, developers need sprint cycles to build and maintain the front-end logic.
Programmatic APIs
Taking it a step further, programmatic APIs give you complete control over the UI. The vendor handles the heavy infrastructure, including the query engine, the semantic layer, and tenant security, then returns raw JSON payloads via REST or GraphQL. You pipe that data into your own charting libraries, like D3.js or Recharts, and build the front end yourself.
Whether you use custom SVGs or bespoke canvas rendering, every pixel is yours to shape. If analytics is core to your product, this is the route that gets the experience right.
Choosing your method
You don't have to pick one path and commit forever. An Embedded Agentic Analytics Platform like WisdomAI lets you scale your integration over time. You can start with a themed iframe to ship in weeks, move to components as your design requirements tighten, and reach for APIs when analytics becomes core to the product.
Take Blend, a digital loan origination platform. They needed a partner to provide self-serve analytics to over 300 lenders while keeping their own engineers focused on what they do best. With WisdomAI, it took Blend just a week to deploy. Today, they are already scaling up and preparing to launch Analytics Agents that automate the recurring data work their customers rely on.
White label analytics in action: Top use cases
The capabilities you embed decide what your customers can actually do with their data, and the right mix usually depends on the industry you serve. Regulated sectors like finance and risk still run on scheduled reporting, while retail and logistics customers want to explore on their own. Let’s look at how this plays out in practice:
Spend management tools delivering automated reports
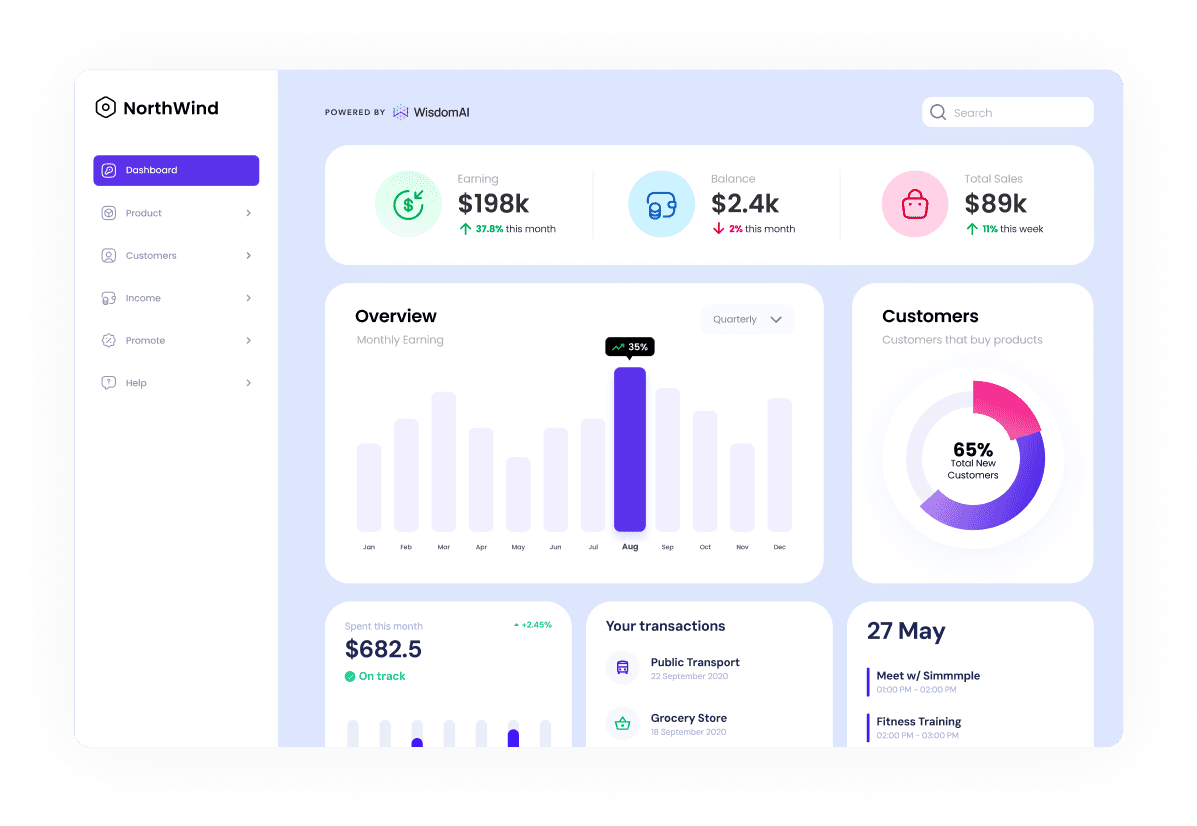
Embedded analytics allow spend management platforms to offer automated financial analysis as a built-in service. Customers can select the metrics they care about and set a schedule, allowing the platform to generate live, detailed breakdowns of their revenue and spend on the first of every month.
Branding carries extra weight here, because the people reading these reports aren't the ones using the product. They go straight to controllers, executives, and budget reviewers. When the report carries your name, they know it came from the system their spend already runs through. An unfamiliar vendor logo introduces a second party nobody in the room contracted with, and the first question stops being what the number says and becomes where it came from.
Marketing agencies letting clients track demos and signups
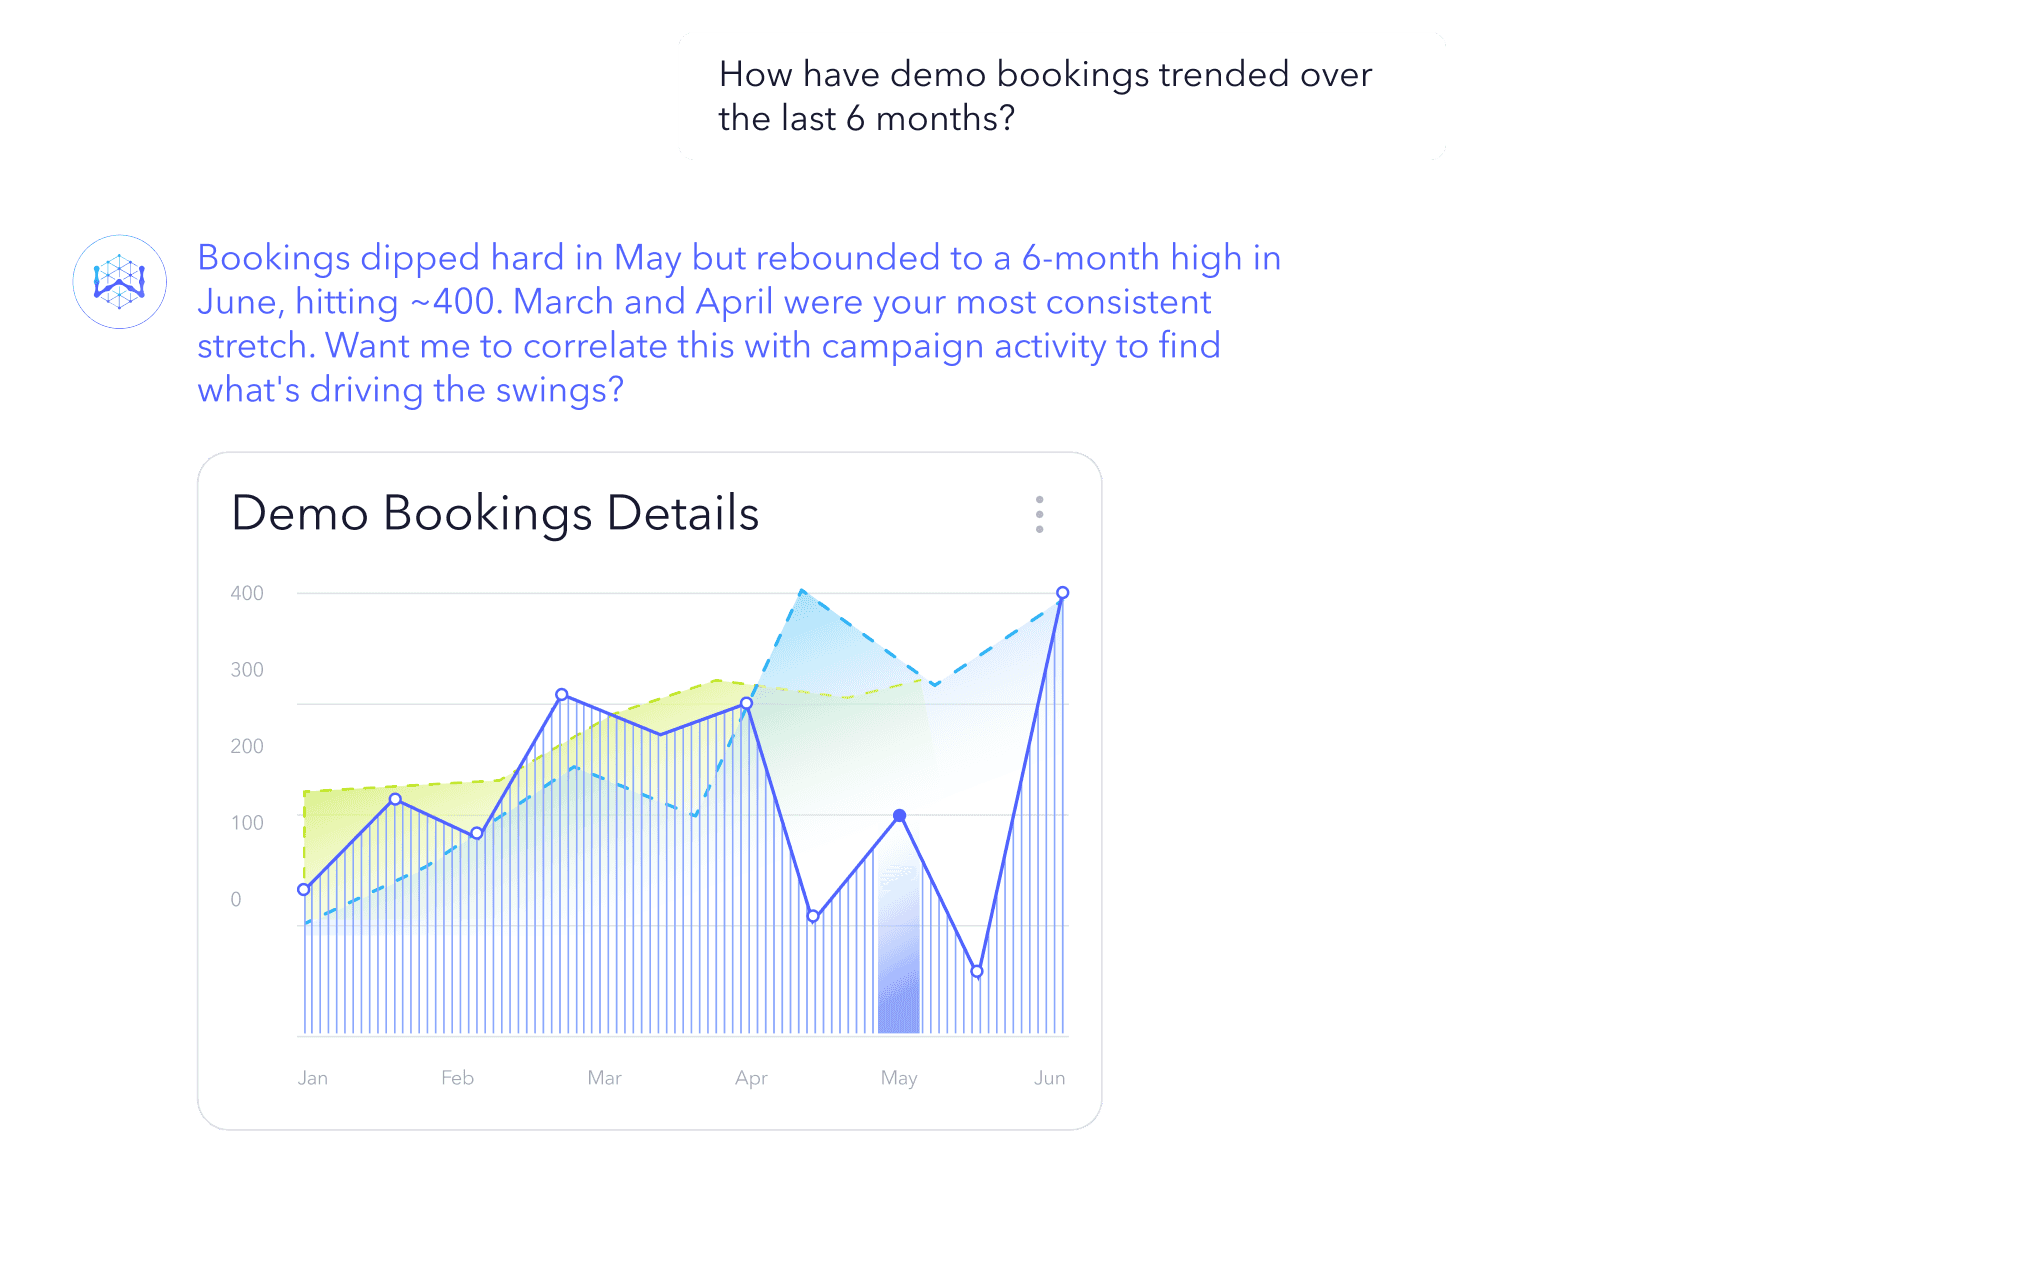
Marketing agencies field daily performance questions from multiple clients. When a client wants to know how their campaigns performed last week, the worst thing your account manager can do is hand them a static Excel file and expect them to hunt for the answers on their own.
Embedding conversational analytics tools lets them explore their data in natural language. They can ask: How many demos did the campaign book? Which creative drove them? How does that compare to paid search? And because it's conversational, they can instantly ask follow-up questions to see the full picture.
Logistics platforms giving customers room to dig
For a logistics platform, giving customers the ability to explore their own shipment trends is critical. A user might narrow their data down to the past six weeks, click on a visualization, and drill straight into the exact depot where delays started. Better yet, AI summaries can automatically surface these anomalies, allowing users to make immediate supply chain decisions.
But this kind of deep exploration demands native navigation. When users are three clicks deep into a drill-down, the filters, text labels, and buttons must behave exactly like the rest of your app. If the dashboard suddenly defaults to an outside vendor's UI conventions, the friction is instant, and users immediately realize they've left your core product.
Elevate your product experience with AI analytics
Right now, every new customer question turns into a support ticket that lands straight in your reporting backlog. An engineer writes a query, a PM scopes a new view, and weeks later, the customer gets a chart they’re almost certainly going to ask you to change. Multiply that across your entire user base, and a meaningful share of your engineering capacity is going into building charts.
Your customers aren't enjoying it either. They wait days for a number, then export it and finish the analysis somewhere else.
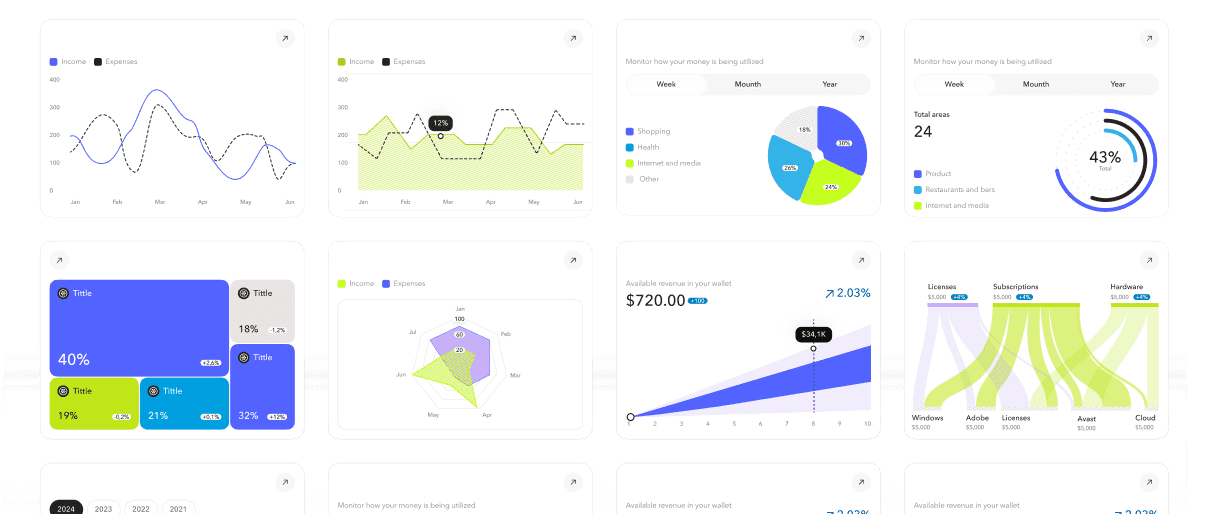
WisdomAI lets you embed AI-powered chat and dashboards on your terms. Using iFrames, Developer SDKs, or GraphQL APIs, your developers can embed anything from a single chart to a fully interactive AI interface in a few lines of code. There's no rebuilding your UI from scratch and no parallel reporting environment to maintain.
Your customers can finally ask their own questions, backed by an Adaptive Context Engine that grounds every answer in your business logic.
Ready to make analytics part of your product? Book a demo.
FEATURED RESOURCES

Embedded AI: Bringing AI Analytics into Your Product
Embedded Analytics
Embedded AI: Bringing AI Analytics into Your Product
What is Embedded Reporting? Benefits and best practices
Embedded Analytics
What is Embedded Reporting? Benefits and best practices
Embedded analytics: The complete guide for product leaders
Embedded analytics