
What is Embedded Reporting? Benefits and best practices
How can embedded reporting turn your product's data into a paid, sellable feature?
Why do customers stick with products where their metrics already live?
What do extensibility, branding, security, and governance look like when embedding is done right?
PUBLISHED:
UPDATED:
Every product generates data, but most leave its value on the table. Too often, your users are switching workflows, wrestling with complex BI tools, and waiting on someone else to pull a number they should be able to see themselves.
Your product teams don’t have it easy either. They are stuck manually exporting CSVs, fielding one-off data requests, and maintaining extensive pipelines when they should be locked in on shipping core features.
What if you could pull double duty with one feature? What if you could free your team from the reporting bottleneck while turning those insights into a premium, sellable feature?
The answer is embedded reporting. And here’s how you get it right.
What is embedded reporting?
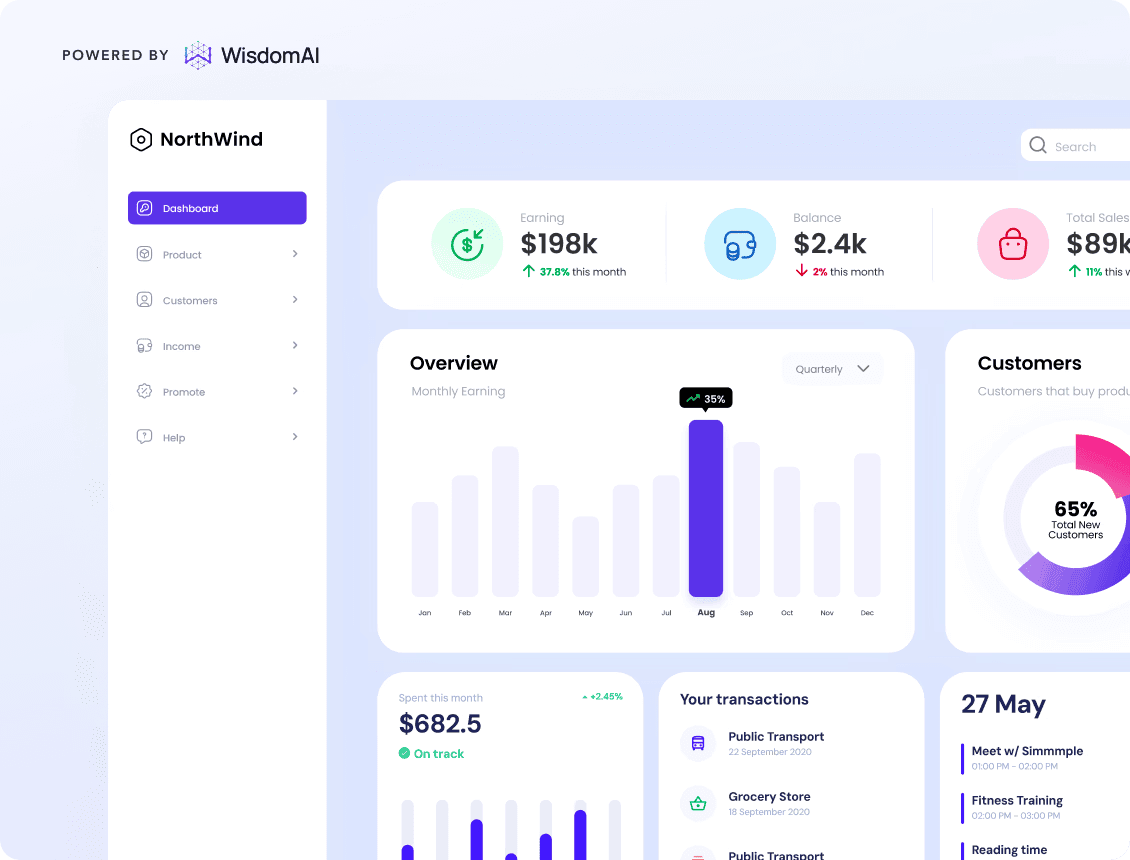
Embedded reporting weaves charts, dashboards, and interactive filters directly into your product’s existing UI. Rather than forcing users to log into a separate BI tool, you deliver contextual insights right where they work.
The mechanics are simple: you embed business intelligence capabilities straight into your product or internal app, typically through APIs, SDKs, or iframes. From there, you decide how the reports look, which rows each customer can see, and how deeply they can drill into the numbers on their own.
Data your customers could never reach on their own now becomes insights they can act on every day.
Embedded reporting vs traditional BI: Which one is right for you?
While traditional BI is built for internal analysts to explore data, embedded reporting is designed to help your customers make day-to-day decisions. Let’s look at how the two approaches compare:
Category | Traditional BI | Embedded reporting |
Primary users | Analysts, executives, and ops teams inside your company. | Your customers and product users. |
Purpose | Explore company data to make internal decisions. | Deliver defined views to customers and end users inside your product. |
Where it lives | A separate application with its own login and learning curve. | Right where users already work. |
Access model | Role-based permissions within the organization. | Multi-tenant architecture with every query scoped to the account making it. |
Data exploration | Open-ended and ad hoc across every table you own. | Defined views with drilldowns you scope. |
Customization | Vendor themes and dashboard layouts. | Full control over layout, styling, and branding. |
Integration | Connectors built to integrate with your warehouse and source systems. | Iframes, developer SDKs, or programmatic APIs |
Skill required | SQL or data modeling. | Self-serve model. Anyone can build charts, reports, and drill into data points. |
This comparison is not an argument for replacing your BI tool. Your data team will always need a dedicated workspace for complex, open-ended data exploration. But your customers need something different: a secure, self-serve way to analyze their data inside your app. Give them that, and you open a new tier of product value your competitors can't easily reach.
How do businesses benefit from embedded reporting?
When executed correctly, embedded reporting impacts everything from your engineering bandwidth to your bottom line. Let’s see how:
Increasing retention and product stickiness
We're living in the attention economy, where companies spend millions competing for every minute of user focus. The moment a customer has to leave your app, you risk losing their attention entirely. Embedded reporting helps you build product retention in three ways:
Frequency of use: When the numbers users care about live inside your product, they come back to check them, almost daily, sometimes even hourly. Every login reinforces a habit that deepens the switching cost.
Time-to-value: Embedding takes days, not quarters. The platform you plug in handles all the technical heavy lifting behind the scenes, so when your customers log in, their data is already there, already visualized. They don't have to set up a warehouse, wait on an analyst, or configure anything. This early win signals that you're serious about shipping innovation, not just promising it.
Personalization: Every user can customize their dashboard around what matters to their job. A finance lead can pin margin trends, a CS manager can monitor account health, and an exec can get the three metrics they actually care about. When users can shape the product around their own role and priorities, they stop treating it as a tool they open just when they need to and start treating it as the place they work from.
Monetizing demand
Your customers know their data is valuable, and they are often willing to pay to understand it better. Embedded reporting gives you multiple ways to monetize that value:
Premium add-on: Bundling AI dashboards, custom report building, and trend analysis alongside your core product creates a highly valuable paid tier. Customers who need more than standard views can upgrade instantly, opening up a predictable revenue line for your business.
Enterprise tier gating: Reserving the most powerful capabilities for your enterprise SKU gives you real leverage in contract negotiations. Features such as cross-workspace reporting, scheduled exports, role-based access controls, and white-labeled dashboards give larger customers clear reasons to upgrade. They are also among the capabilities procurement and security teams expect when evaluating an AI analytics platform.
New customer expansion: Introducing advanced analytical capabilities elevates your product from a standard workflow tool to a comprehensive platform. With a more sophisticated data offering, you can attract, target, and close entirely new segments of customers you previously couldn't compete for.
Boosting competitive differentiation
Core functionality reaches feature parity quickly. But data is unique, and customers can analyze their own usage in ways they can't find anywhere else. That's what makes it your strongest moat:
Category perception: A polished, embedded analytics experience instantly repositions your product as the mature, enterprise-ready option. Buyers stop comparing you to the other tools in the same category and start comparing you to the platform they're ready to standardize on.
Proof of concept: Picture the sales call where your product surfaces a live, branded dashboard the buyer can filter and drill into on the spot, while the competitor's answer is "we'll email you a CSV." That contrast is often a deciding factor.
Total cost of ownership: Choosing your product means your buyers only have to manage one license, one implementation, and one integration. What looks like a simple line-item savings on paper quickly becomes one of your strongest arguments in a competitive sales cycle.
How to get embedded reporting right
Shipping embedded reporting isn't just a design or engineering exercise. It's a decision about how tightly analytics should be woven into your product. The teams that get it right treat these things as non-negotiable:
Extensibility
As businesses evolve, your customers will demand more. They'll need custom metrics, their own calculated fields, or even AI Analysts that can trigger workflows on their behalf. As a product leader, your job is to anticipate those demands and pick a partner that can help you ship a self-serve, extensible analytics layer that keeps pace with your roadmap.
Look at how WisdomAI's Agentic Analytics Platform handles this. You can start small by embedding foundational reports and AI dashboards, then expand into Analytics Agents that run multi-step analyses to answer the questions static dashboards can't — the why did this happen, what changed, and what should we do about it questions that historically required a human analyst on standby.
Branding and white-labeling
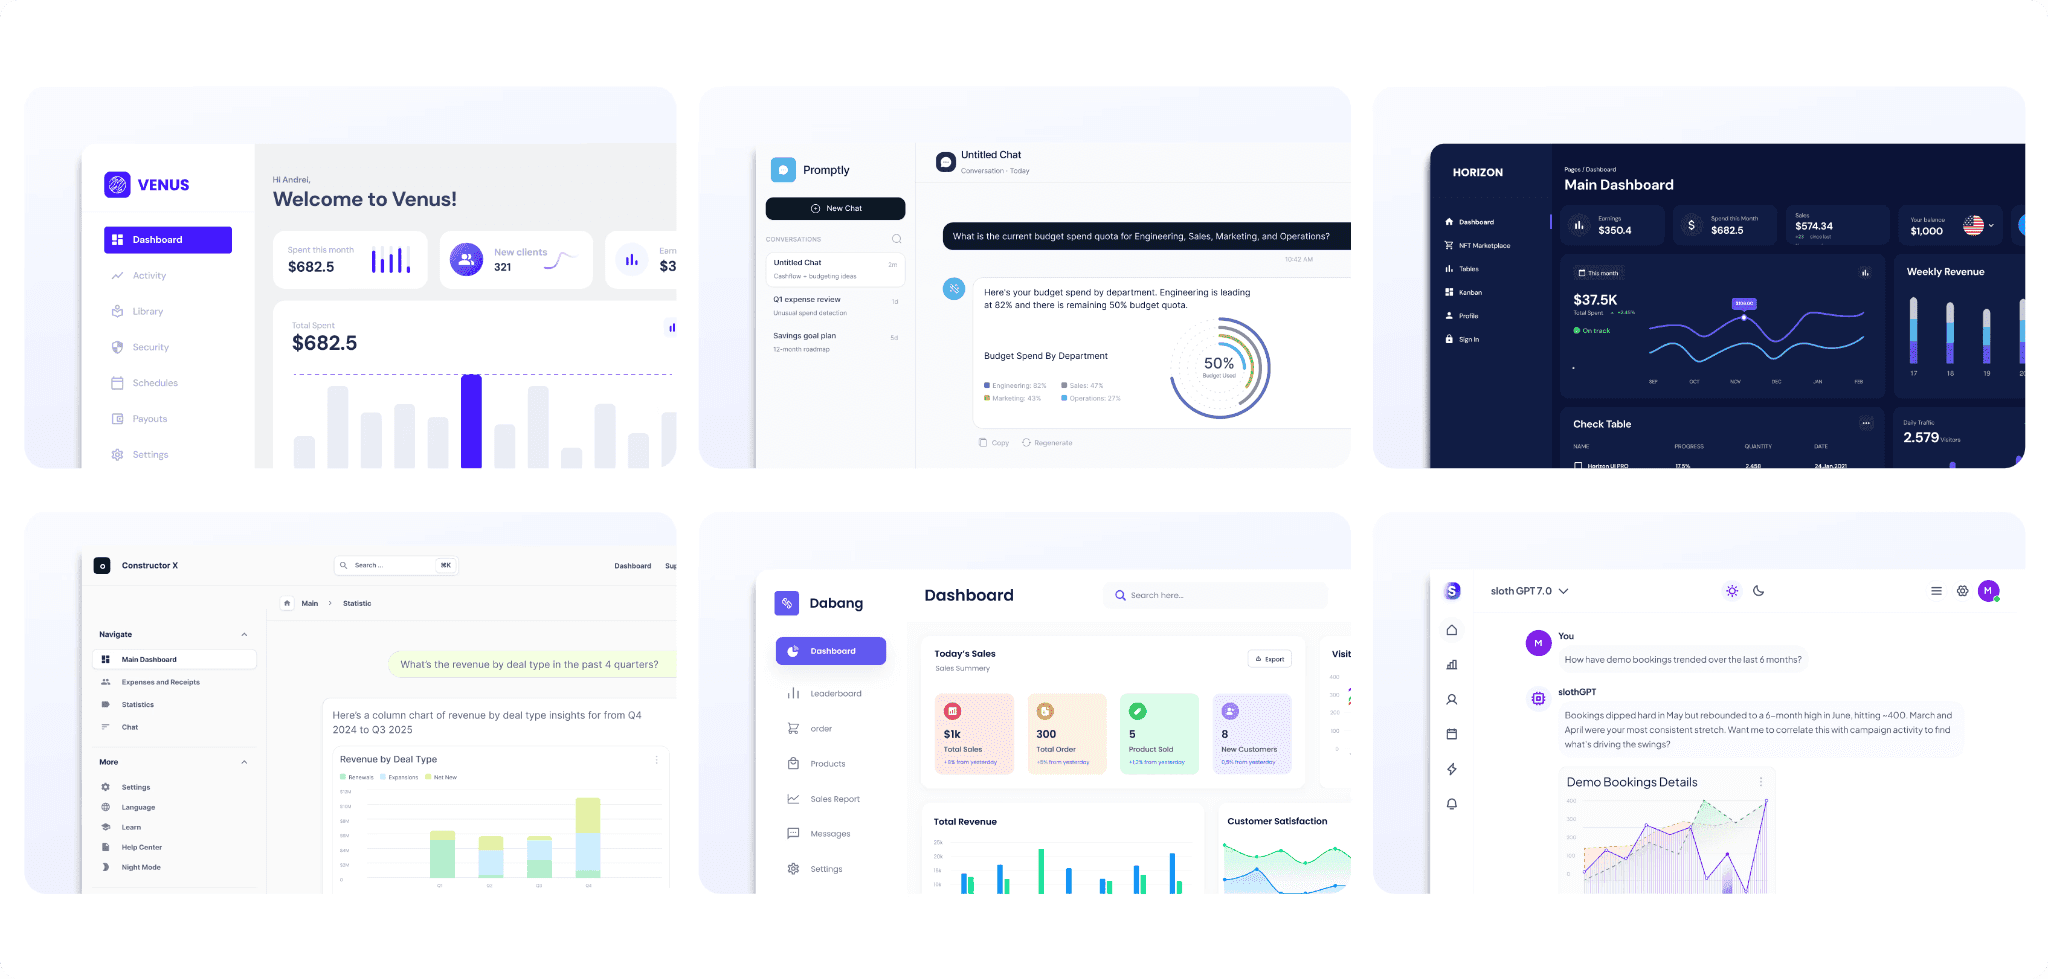
If your reporting feels like a different product bolted onto yours, having mismatched fonts, clashing colors, and a vendor logo tucked in the corner, you're undercutting the strategic value you set out to create in the first place.
The whole point of embedding is that your brand owns the entire surface, not just the wrapper around it. White labeling extends that ownership to every detail: typography, spacing, empty states, error messages, even the loading animations. Done right, users never register that analytics is a separate capability.
Security
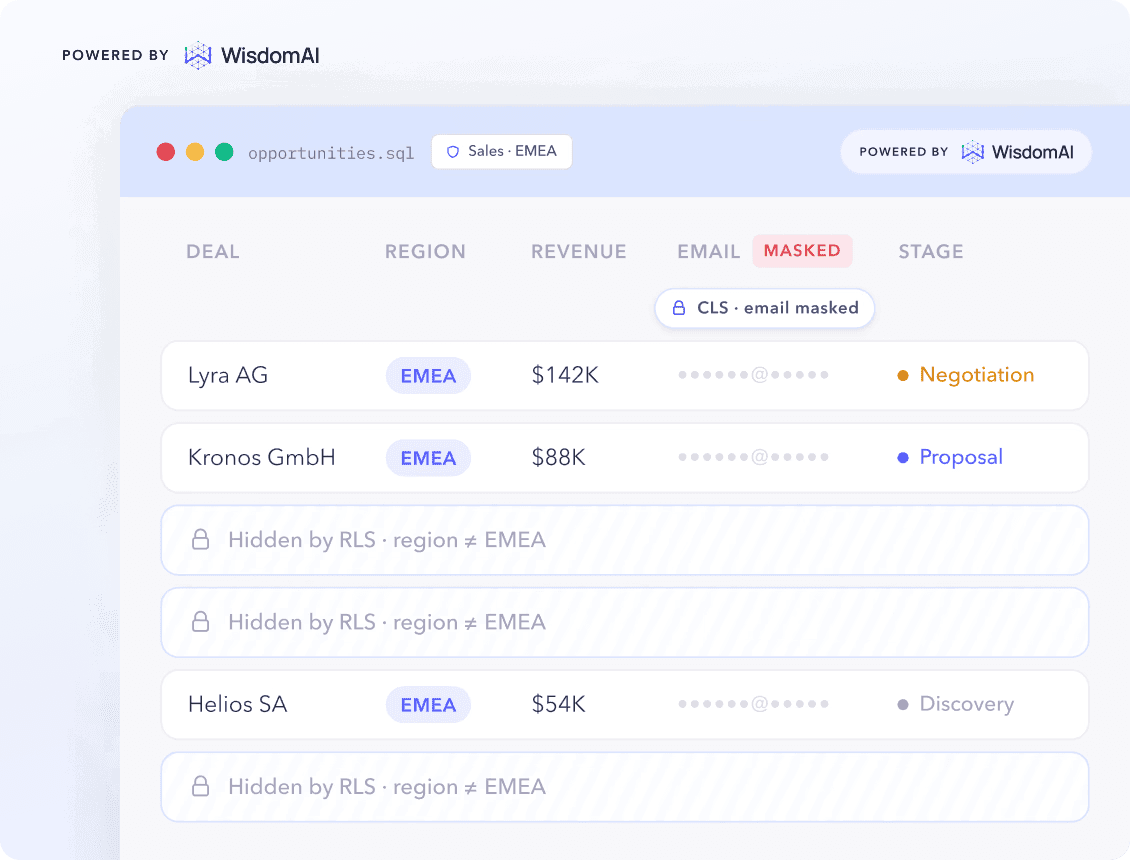
Your analytics layer touches data from every tenant on your platform, making strict data isolation a defining rule. It means enforcing row and column-level permissions directly at the query layer.
It also requires a unified security posture. Your embedded solution should inherit your existing identity model, which means a customer's SSO and role-based access automatically apply to their reports, and every query run against the system should be logged and auditable.
Buyers, especially the ones on the enterprise end, will scrutinize this architecture during security reviews, so getting it right the first time is the only way to avoid painful retrofits later.
Governance
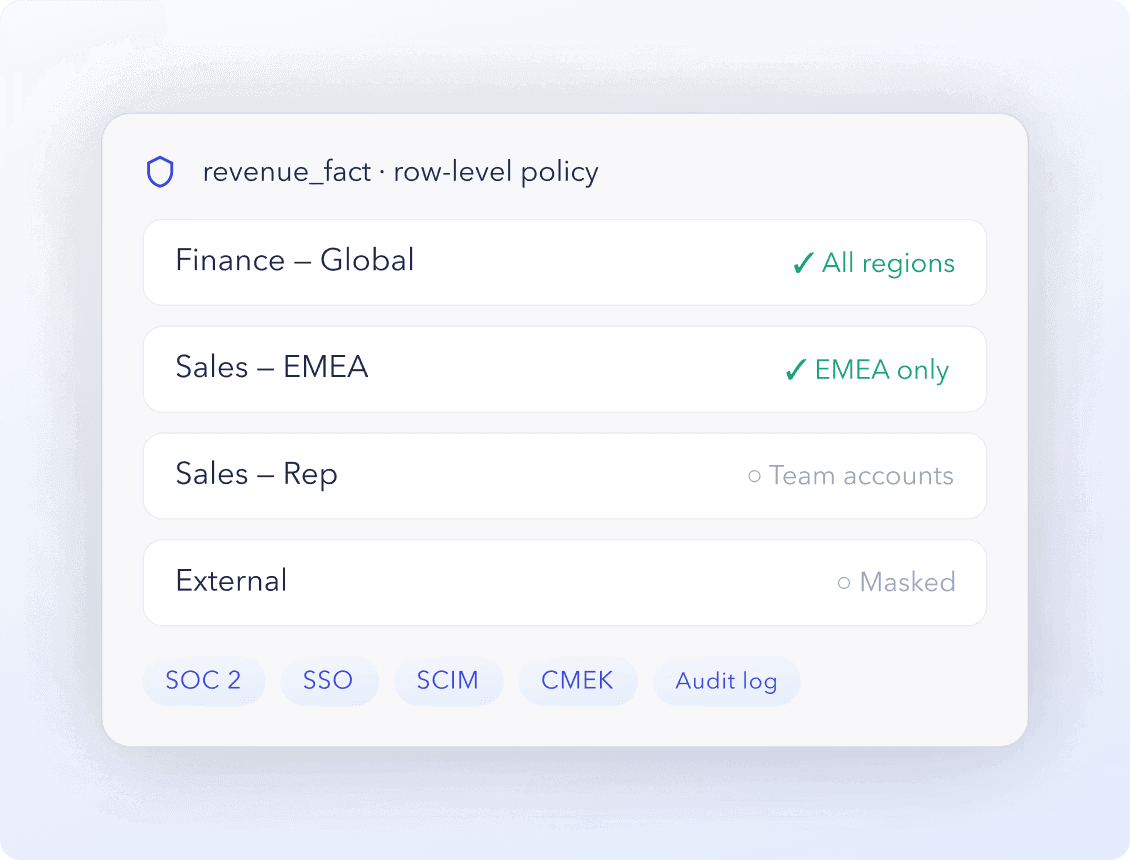
Governance is what keeps embedded reporting trustworthy as your platform scales. Without it, dashboards proliferate, definitions drift, and users start second-guessing the numbers on their own screens. This goes beyond a semantic layer. With an adaptive context management system and an enforceable governance policy in place, every metric has an owner, every change is versioned, and every user knows exactly which sources are powering their analysis.
Real-world applications of embedded reporting
Blend: Turning dashboards into a shared management asset
Blend, a digital loan origination platform, embedded WisdomAI directly into the product its lenders use every day. The result: lenders can now generate AI-powered dashboards on the fly, save them, and instantly share them across their organization. What used to be a fragmented process of one-off exports and static reports has turned into a strategic lever that keeps entire teams aligned on a single source of truth.
Cloverleaf Analytics: Empowering users to make smarter, quicker decisions
Cloverleaf Analytics provides an analytics platform for property and casualty insurers. They ran dedicated Snowflake environments for each customer and offered OEM analytics tools embedded directly inside their product. It's a powerful setup, but with data scattered across every customer's environment, Cloverleaf needed a way to deliver governed, natural-language question answering inside its platform.
By embedding WisdomAI, insurers can now simply type "which policies renewed above target premium last quarter?" and get an answer grounded in their own data.
Deliver trusted, governed insights across every surface
The question isn't whether your customers want analytics. It’s how fast you can turn it into an experience your customers will use, love, and happily pay for.
With WisdomAI, making this shift takes days. You can embed AI-powered chat and dynamic dashboards with just a few lines of code, whether you prefer iFrames, our developer SDKs, or the GraphQL API. And with Adaptive Context Engine, every answer served across your product remains perfectly grounded in your customers' unique business logic.
Embed analytics the way you want. Book a demo today.
FEATURED RESOURCES

Embedded AI: Bringing AI Analytics into Your Product
Embedded Analytics
Embedded AI: Bringing AI Analytics into Your Product
The case for white label analytics: Is it worth investing in?
embedded analytics
The case for white label analytics: Is it worth investing in?
Embedded analytics: The complete guide for product leaders
Embedded analytics