
Data Analytics vs Business Intelligence: Where should you invest?
Why business intelligence and data analytics solve different problems for different people
What LLMs change for analysts and business users across the analytics workflow
How to close the AI context gap and decide where your next investment belongs
PUBLISHED:
UPDATED:
Business intelligence is built for business leaders, known for visual dashboards and simple answers. Data analytics was built for your analysts—the ones who dig deeper into the numbers, write queries, and find patterns.
For the past 20 years, this split worked. Your business team got answers, while your analysts had the flexibility to explore.
Then LLMs arrived and collapsed this distinction. Your team can now ask questions in natural language and get instant answers. Your analysts can explore data without writing SQL, or they can deploy the help of an LLM to support code generation.
Sounds great, right? Except the reality is messier. The business is now finding answers that may look right, but are actually wrong. Meanwhile, the data team is busier than ever—validating answers, fixing mistakes, and clarifying what the AI got wrong.
Business intelligence and data analytics have evolved. Here's how to build the right balance for your team.
What is data analytics in business?
Data analytics is the practice of examining data to answer questions, identify trends, and extract insights.
Four main types of data analytics
Descriptive analytics: “What happened?”
Diagnostic analytics: “Why did this happen?”
Predictive analytics: “What might happen in the future?”
Prescriptive analytics: “What should we do next?”
For example, a hotel booking platform uses all four to help both travelers and owners make better decisions:
Descriptive analytics:
Hotel owners see dashboards showing room nights, revenue, and average daily rates over the last 30 days. They know their sales performance at a glance.
Diagnostic analytics:
A spike in cancellations? They can view reports showing patterns—maybe it's tied to a specific booking window or holiday.
Predictive analytics:
Travelers see which dates will be packed and which won't. Peak season costs more. Off-peak costs less. They book strategically based on budget and schedule.
Prescriptive analytics:
You get specific recommendations. The platform suggests: "Hotels like yours are booking 20% more guests with a mobile-only rate. Try it."
Up until a few years ago, every technique required different tools and people. Descriptive and diagnostic meant dashboards and SQL. Predictive meant hiring data scientists with more advanced coding languages like python. Prescriptive meant hardcoding business rules by hand and connecting to systems that most BI tools couldn’t access.
That’s why most businesses never got past descriptive. GenAI, or as we like to call it — GenBI, changed that. One LLM can now answer all four types of data analysis instantly. But getting it right — that's where the real work begins. We'll uncover what that means as we go.
What is business intelligence (BI)?
Business intelligence is the use of business data for day-to-day operational management. You can use BI dashboards to understand what is happening in your business at any given time.
Let's take the same hotel booking platform example. BI would provide you with real-time dashboards showing occupancy rates, cancellations, and customer satisfaction scores. But turning this insight into action is often the most difficult part.
Most businesses look at the dashboards and then get stuck. They see what's happening, but they don’t know how to interpret the data — or even if they do, in many cases, they don't know what to do about it.
Before we get to how AI solves this, let's understand the BI world a little better. Starting with its limitations.
Limitations of legacy BI
Legacy BI offers static dashboards that provide snapshots of what happened. But they fall short when you need depth, flexibility, or speed. Here's where they struggle:
1. Restrictive exploration
Say you have a question that falls outside the parameters of an existing dashboard. Now what? The whole self-service BI model breaks down. You submit a ticket to your data team. They modify a SQL query, build a new visualization, and create a new dashboard. Weeks go by. Meanwhile, you've moved on to other priorities.
This creates a second problem: dashboard sprawl. You end up with so many dashboards that finding the right one becomes harder than getting the answer in the first place.
2. Analysis paralysis
When you have too much information to make a decision, analysis paralysis is kicks in. This can look like too many dashboards — perhaps even with conflicting results — leaving you with reports you don't trust and data you can't find.
The result is inaction, as you spend over half of your time managing information rather than using it productively.
3. Cost of ownership
While traditional BI is built for the business team, it’s important to note that it is still built and maintained by the data team. This dichotomy means that the total cost of ownership is not just in the tool itself, but also the team hours that go into the setup and maintenance.
In many cases, businesses have reported spending weeks or even months on a single dashboard, just for it to become a relic collecting digital dust.
Data Analytics vs. Business Intelligence (BI)
Feature | Data Analytics | Business Intelligence (BI) |
Built for | Designed for data specialists who dig deep into numbers, write custom queries, find patterns, and explore relationships. | Designed for executives and decision-makers who need quick, clean, and simple answers to guide their operations. |
Primary focus | Focuses on examining data holistically to answer specific business questions, identify hidden trends, and project future outcomes. | Focuses on real-time snapshots to understand exactly what is happening in the business at any given time. |
Core outputs | Custom queries, data exploration models, trend reports, and relationship mapping. | Clean, standardized, static dashboards and high-level operational metrics. |
Analytical Depth | Spans all Four Main Types of analytics: Descriptive (What happened?), Diagnostic (Why?), Predictive (What might happen?), and Prescriptive (What should we do next?). | Historically stuck in the Descriptive and Diagnostic phases (looking at what happened and basic metrics like room nights or occupancy rates). |
Traditional Workflow Gaps | Historically required entirely different tools and specialized skillsets for different stages. | Any question outside the fixed dashboard requires a data team ticket, taking weeks to modify SQL queries. |
Using LLMs to address the gaps in your analytical workflows
The introduction of LLMs represented a shift in how data is presented to users. Instead of navigating a complex UI of filters and dropdowns, you can simply “chat with your data.”
LLMs for analysts
For your technical team, AI-powered analytics shift the burden away from tedious syntax and manual wrangling, freeing analysts to focus on higher-value work:
Automating data preparation
Excels at parsing messy, semi-structured data. They can classify text and map inconsistent strings into clean formats before the data hits your warehouse pipeline.
Accelerating code generation
Instead of writing SQL joins or more complex modeling languages, analysts simply describe the logic they need. The LLM generates the baseline code in seconds, drastically shortening your development cycles.
Building custom data applications
Developers can spin up analytical micro-apps tailored to specific workflows, delivering precise answers without the overhead of a massive enterprise BI rollout.
Automating analytics workflows
Additionally, agentic analytics allows the data team to build a single analytics workflow to automate regular manual reporting. For instance, you know that this business team runs a weekly report, create a workflow for it instead.
Many believe this might be the future of reporting, leaving the ad-hoc analytics to conversational analytics.
LLMs for business users
For business leaders, LLMs eliminate the interface friction that has plagued legacy BI for decades, replacing static charts with dynamic exploration.
Natural-language querying
No more submitting tickets and waiting weeks. You can now "chat with your data." A simple prompt like "Show me our most profitable region last month" is instantly translated into a conversational BI query.
AI-powered visualization on the fly
You're no longer trapped in a fixed layout. You can ask the AI to "turn this table into a trend line and highlight anomalies," and it builds the right view based on your intent. Or, take it a step further and ask your LLM to turn your analysis into a branded powerpoint report.
Eliminating dashboard sprawl
Because you can generate tailored answers in real time, you can stop building "just-in-case" dashboards. This clears the clutter and directly combats analysis paralysis.
Just as with the data team, you can also deploy agents to deliver your regular reporting to your preferred communication channel. You can even have these agents trigger action in your business tools, connecting insight to action. This is the future of business intelligence.
The tradeoffs in AI-powered analytics
While LLMs are proficient at writing SQL, they cannot understand business intent without enterprise AI context. An LLM looking at a raw data warehouse sees thousands of tables with cryptic names like “fct_sls_v2” and “dim_cust_final.”
Without a mapping of what tables and columns represent in plain language, the LLM can hallucinate or join tables incorrectly. The LLM is limited by the metadata it is given, which is often called the context gap.
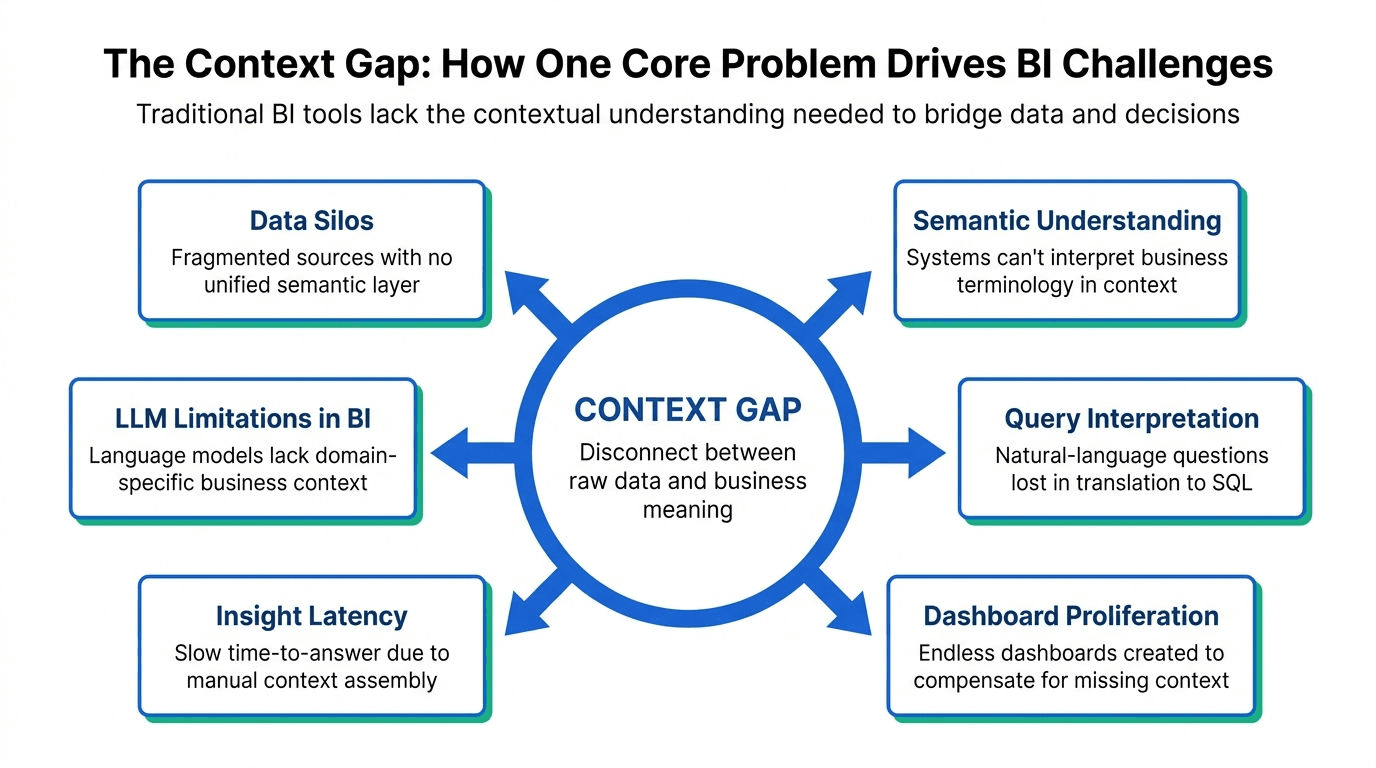
The context gap in data analytics and business intelligence
The context gap represents a disconnect between an LLM’s general-purpose training and the reality of enterprise data. Most semantic layers focus on SQL mappings but fail to capture the operational “why” behind the data, such as why certain accounts are excluded from a monthly active user count during a specific board-driven refresh. This leads to semantic misalignment, where a model provides a query that is mathematically correct but operationally wrong.
For example, context may tell an LLM that the business fiscal year ends in October, not December, and that revenue is defined differently across teams.
How to solve the AI context gap?
AI systems must be connected to enterprise context. This context is built and maintained through a context development lifecycle (CDLC) that continuously learns your business from query logs, documentation, and how your team actually uses data. Here's what's needed:
Context layer
AI context is available from many different sources and data types.
Context about the data sources available to answer questions needs to be described. Data context tells the LLM what tables exist, how they relate, and what the columns mean.
Business context tells the LLM which tables to trust and which joins to use. This information is available in existing semantic layers and in unstructured data sources such as business reports and knowledge repositories.
Historical context, like query logs, provides the LLM with previous questions and the SQL generated.
Presentational context helps the LLM tailor its answers to the user who asks the question. This could mean restricting access to certain data sources or presenting the information with a narrative summary rather than just raw numbers.
These 4 layers of context need to be ingested, stored, and maintained in a context engine.
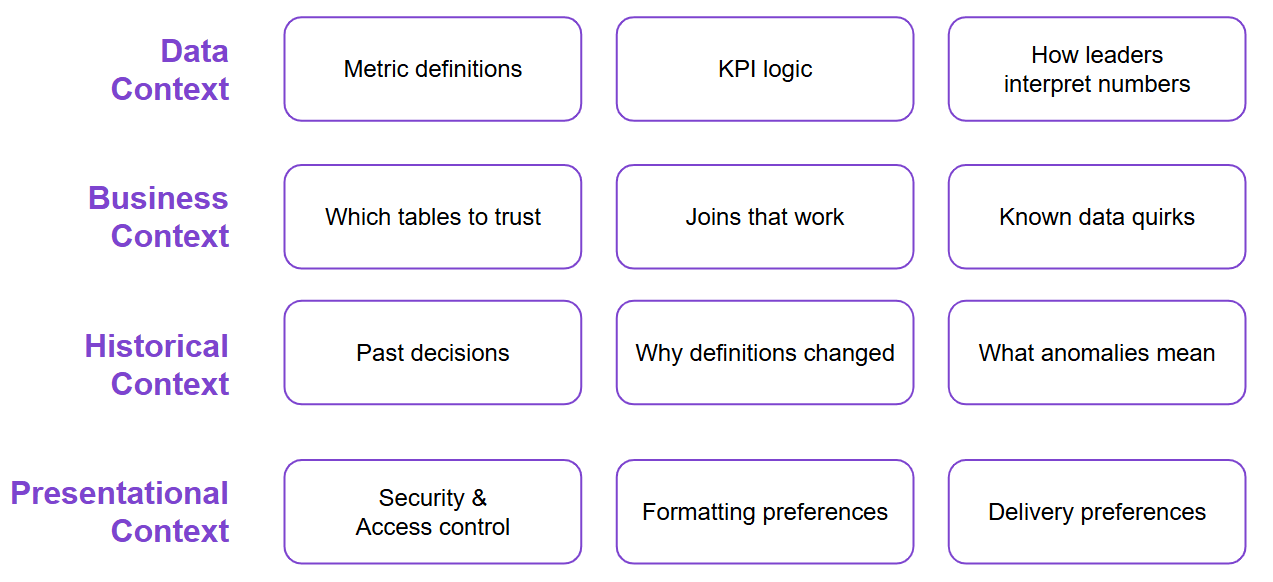
The 4 layers of context in the context layer
Context engine
All LLMs have a finite context window, a limited attention mechanism, and an uneven distribution of attention — a phenomenon often referred to as the lost-in-the-middle problem. An LLM performs better with the right information. Feed it noise and it amplifies it. Feed it the correct signals, and it works correctly.
The trick is precision. An AI Context Engineer filters the noise by pulling the right data sources, relevant columns, and company-specific definitions while trimming old conversation history. It then packages everything into clean JSON or Markdown, so the LLM can parse it without friction.
Context monitoring and conflict resolution
As your organization evolves, business rules and metric definitions change. Without proactive monitoring, your AI continues to use stale definitions—a problem known as context drift.
The monitoring layer resolves these context conflicts. When a conflict is detected, the system applies a predefined resolution hierarchy. Finance gets its definition for executive reports. Marketing gets its for campaign analysis. The right context reaches the right user.
As a result, your AI always works with current, contextually appropriate information before it even processes the question.
Keep learning: Register for our free AI Context Engineer Certification
Where to invest: BI, data analytics, or AI-powered analytics?
Strategic allocation across budget, personnel, and technology stacks often presents a trilemma: prioritize legacy BI platforms, augment data science capabilities, or transition to a full AI-driven strategy. The decision matrix simplifies upon evaluating the core delivery mechanism of each approach.
Examine delivery methods to determine investment models
Business Intelligence (BI) is for set metrics
If the primary objective is to monitor known variables—tracking standard KPIs, generating weekly operational reports, and maintaining a single source of truth for historical data—traditional BI is functional. However, it maintains a rigid, reactive posture.
Data Analytics is for exploration
Deep data analytics is essential for investigating the why behind the numbers, identifying hidden patterns, and building predictive models. While it offers flexibility for investigation, it has historically been bottlenecked by technical complexity and protracted engineering queues.
AI-powered analytics lets you apply both
AI analytics removes the forced choice between the structured certainty of BI and the exploratory freedom of deep data analytics.
The most important investment: AI context
Investing in AI-powered analytics isn’t about scrapping your legacy stack; it’s about finally making it work for you. By layering an Adaptive Context Engine over your existing infrastructure, you eliminate the forced choice between structured BI and deep exploration, delivering the best of both worlds in real time:
Democratic scale: Business leaders get the clean, instant answers they expect from a dashboard, but with the exploratory freedom to ask complex questions in plain English.
Analytical Agents: Technical teams are freed from the drudgery of dashboard maintenance and SQL tweaks. Instead, they use analytical agents to handle analysis at an enterprise scale.
Case study: How a mortgage leader retired 95% of BI dashboards
HomeStory, a mortgage operations firm, had the same problem most data teams know too well — dozens of legacy BI dashboards, most of them stale, many of them contradicting each other. Analysts spent more time maintaining reports than actually analyzing anything.
They replaced that infrastructure with WisdomAI's Agentic Analytics Platform. Instead of dashboards waiting to be checked, Analytics agents now monitor mortgage operations in real time and push specific insights to the right people when they need them.
The result: HomeStory retired 95% of its legacy dashboards. Analysts stopped hunting for data and started receiving answers they could act on immediately. The team went from reactive reporting to proactive decision-making.
WisdomAI: From static dashboards to autonomous agents
The transition from legacy BI to agentic analytics requires a fundamental shift in architecture, moving beyond simple prompt-and-response mechanisms to a system grounded in a continuous, governed context.
WisdomAI is built around:
Analytics Agents: Autonomous, reasoning-driven agents that proactively monitor and synthesize insights across all structured and unstructured data sources.
Conversational BI: A natural-language interface that interprets ambiguous questions and instantly translates user intent into governed, accurate data queries.
Adaptive Context Engine (ACE): A continuously learning system that codifies semantic definitions, tribal knowledge, and operational memory to ground every insight in governed, enterprise-specific context.
With these foundational pillars, the platform provides the end-to-end architecture required to transform data strategy from reactive reporting to autonomous, trustworthy insight delivery.
Start building the foundation of trustworthy analytics. Book your demo today.
Summary of key data analytics and business intelligence concepts
Concept | Description |
Data analytics | The practice of examining data to answer questions and extract insights, which is typically divided into four types:
|
Business intelligence (BI) | The use of business data for day-to-day operational management is often delivered through real-time dashboards. |
Agentic analytics | A goal-oriented system of autonomous AI agents that can reason over data, monitor business continuously, and surface insights proactively rather than just responding to queries. |
AI context | The background information (data, business, historical, and presentational) is provided to a model to ensure accurate, business-specific responses. |
Context gap | The disconnect between an LLM's general training and the specialized “tribal knowledge” or unwritten business rules of an enterprise. |
Adaptive Context Engine (ACE) | A technical architecture component that bootstraps and maintains business context by ingesting metadata, query logs, and user feedback. |
Analytics Agents | AI agents that monitor data continuously to push alerts and insights to stakeholders at the exact moment they are needed. |
