Guide
Best AI for Data Analysis
The latest generative business intelligence (GenBI) advancements are driven by the capabilities of large language models (LLMs) to facilitate conversational data analysis interfaces. Conversational data analysis interfaces are being added to legacy BI tools, but these tools were designed to perform descriptive data analysis and answer the question “what happened?” AI-first systems are designed for predictive and prescriptive analytics; they answer "what will happen next?" and "what should we do about it?"
To do this, AI-first systems need four main system components: context, code generation, an evaluation framework, and feedback. These backend components need to be coupled with a frontend user interface designed for conversational data analysis, not drag-and-drop dashboard building.
This article explores the five main system components required for AI-based data analysis and compares the implementation approaches for legacy BI tools against AI-first data analysis systems.
Summary of key AI for data analysis features
This table summarizes the core features that an AI system for data analysis requires.
Feature | Description |
|---|---|
Context layer | Semantic layers in BI tools standardize business terms and logic for consistent reporting, but their static nature limits AI's dynamic, multi-source queries. Next-generation context layers overcome this issue by integrating external knowledge and learning from historical user interactions to broaden data analysis. |
Code generation and data integration | Code generation translates natural language into code using an LLM. Legacy BI tools (like Power BI or Tableau) have a simple approach, relying on highly structured metadata and being limited to querying data already within the dashboard, often generating tool-specific code like DAX. In contrast, AI-first platforms like WisdomAI can address more complex, multi-step generation tasks, using a rich context spanning cross-platform, multi-modal data (including schemas, APIs, and documents) to produce SQL or Python for data querying. |
Feedback sources | The context layer in AI-first systems is updated using feedback loops to maintain and improve accuracy. A primary source of this feedback is user input, which can be explicit (flagging errors in generated queries or insights) or implicit (inferred from user actions like follow-up questions or interaction with specific visualizations). Additionally, system feedback monitors changes in the underlying data schema, new sources, or updated metric definitions to inform future improvements. |
Evaluation capability | Online evaluation for data analysis must confirm both semantic correctness (ensuring that the user's intent was correctly interpreted) and execution accuracy (verifying that the query ran successfully with results consistent with expected data patterns). Legacy BI tools use simpler evaluation due to a limited data scope. AI-first systems manage a broader scope by using a context layer for disambiguation, and they validate results against established ground truth, such as historical trends or known facts, to flag anomalies. |
Interactive user interface | AI-first data analysis systems shift the UI from static dashboards to conversational interaction, where users explore data by asking questions rather than using drag-and-drop building. System responses feature multi-modal output, including a text summary, visualization, source data, reasoning, and the generated query. These systems also incorporate proactive agents that function as virtual assistants to monitor metrics, detect anomalies based on user-defined triggers, and deliver automated insights via alerts. |
Context layer
The lack of proper business context to derive value from business data is well-known from legacy BI tools. Semantic layers were developed to standardize business terminology (linguistic context) and business logic (metric context) so that dashboards created by different analysts would be comparable. For example, a semantic layer should standardize whether “revenue” means gross sales, net sales, or adjusted revenue after returns.
Without semantic layers, report consumers spent more time debating whose numbers were correct than using the data to drive business decisions. The semantic layer provides a consistent data view, allowing non-technical users to create reports and dashboards by managing the translation between the BI tool and the underlying database.
Semantic layer limitations
AI integrations in legacy BI tools use semantic layers to provide context to LLMs. The semantic layer helps translate the user's natural language query into abstract table and column names. If a user starts by asking “what account executives have achieved the highest sales revenue by vertical?” and follows up with “what is my revenue by state?” The semantic layer provides definitions for account executive, revenue, and vertical to query the right tables and columns.
The main limitation of these integrations is that the querying scope is restricted to the tables included in the dashboard. Broadening the query to include more data sources is challenging because semantic layers were not designed to be frequently updated.
The strength of a semantic layer is that it remains consistent, so new dashboards are consistent with previous definitions; the semantic layer is a pre-defined map of business terminology and business logic. However, this is at odds with the dynamic and conversational nature of AI-based data analysis.
Context layer
Next-generation AI-driven BI tools recognize the limitations of semantic layers, especially when incorporating data sources beyond individual dashboards. Context layers enable external knowledge to be integrated so that context is added from multiple data sources. By integrating historical query log data, a context layer captures real-world usage patterns to provide broader querying capabilities across multiple data sources.
Context layers are also stateful and learn from past user sessions. Where a semantic layer only defines what a metric is, a context layer also defines who is asking, when they asked, and why they are asking. The diagram below (left) shows sources of metadata that the WisdomAI Context Layer ingests and the continuous sources of context obtained from user feedback.
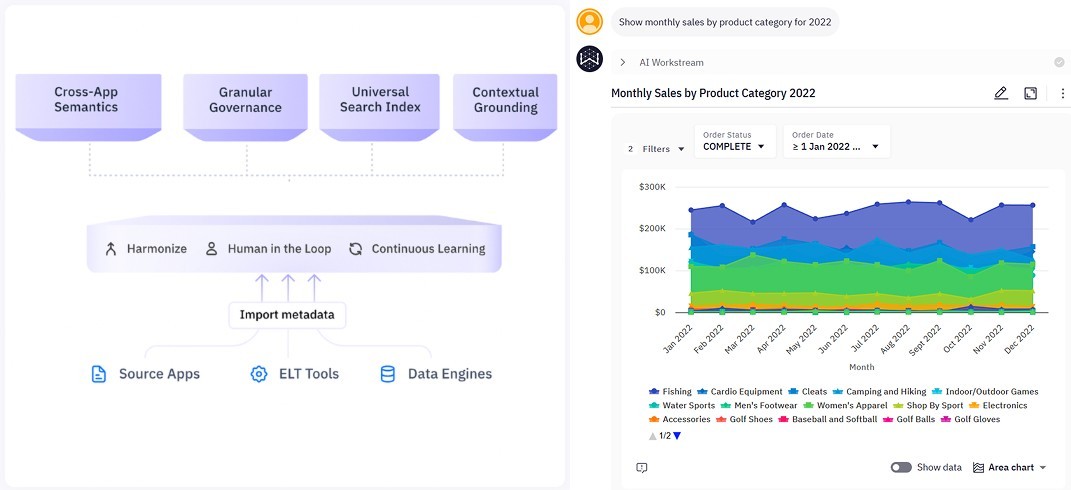
WisdomAI next-generation AI-driven BI (Source)
Here’s how semantic and context layers compare in terms of capabilities.
Feature/Capability | Traditional Semantic Layer | Context Layer |
|---|---|---|
Primary Design Focus | Provide a consistent, business-friendly abstraction over relational databases. | Dynamic reasoning, conversational context, and insight generation. |
Semantic Foundation | Tabular/relational metadata and calculated Measures (DAX/M). | Ontologies, Knowledge Graphs, Universal Metrics Store, Vector Embeddings. |
Context Handling | Static definitions; implicit reliance on user/report context; weak memory. | Dynamic context ingestion (Retrieval Augmented Generation), explicit conversational state tracking, and external knowledge injection. |
Text-to-SQL function | Basic NLQ to simple SQL/DAX conversion; lacks validation feedback. | LLM Text-to-SQL pipeline with query validation, intent routing, and tool-calling. |
Transparency/Trust | Black-box metric logic (e.g., hidden DAX). | Explainable reasoning, traceable lineage, and grounding sources (RAG citations). |
Code generation and data integration
Code generation is the process where an LLM translates a natural language query into code, usually SQL or Python, to retrieve data. The complexity of the code generation approach depends on the data sources that the AI-system is expected to access.
Legacy BI tools
Legacy BI tools have a limited data scope because they are only operating within a predefined dashboard, and the LLM only needs to generate tool specific code. For example, in Power BI, the primary code generated is in the form of Data Analysis Expressions (DAX). The input for the LLM is highly structured metadata from the star schema, and the scope of the query is restricted by the data tables already in the dashboard. If a user asks a question outside this scope, the system will not be able to answer the query.
An AI-first tool
AI-first platforms like WisdomAI are designed to operate over cross-platform data environments. The code generation is more complex and involves multiple steps. The input for the LLM can include SQL schemas, API definitions, unstructured documents, and a user’s interaction history. The code generated can include SQL or Python to perform API calls and is often a multi-step process involving different data agents.
Comparison
Here’s a summary of how the two compare.
Tool Category | Code Generation Approach | Focus and Limitations |
|---|---|---|
Legacy BI | LLM queries the semantic layer for metrics, then generates a query for the underlying dashboard tables. | Focus: Structured data within the BI tool's scope. Limitation: Inability to easily query and integrate external or unstructured data sources. |
AI-first (WisdomAI) | LLM generates SQL or API calls based on a rich, dynamic context layer that spans multiple structured and unstructured sources. | Focus: Flexibility, conversational flow, and multi-modal data (structured and unstructured). Advantage: WisdomAI's Model Context Protocol (MCP) allows it to connect seamlessly to any data source, including complex APIs and documents. |
Feedback sources
Unlike a semantic layer, the context layer is designed to be frequently updated. Feedback loops are used in AI-first systems to maintain accuracy and continuously improve context. A major source of feedback comes from users performing data analysis. This user feedback takes two main forms:
Explicit feedback is where a user flags a generated query or insights as wrong or unhelpful. The system logs the original prompt, the generated code, and the error context. This information is stored within the context layer to improve future results.
Implicit feedback is gained by learning from user usage; user actions are data points for future sessions. For example, a user asking a follow-up question is indicating that the original response had value. Or, if two visualizations are produced and the user only interacts with one, this indicates a preference. Implicit feedback enables AI-first data analysis systems to adapt responses based on who is asking the questions.
Beyond user feedback, there is system feedback as well: AI-first systems detect changes in underlying schemas, new data sources, or updated metric definitions.
Evaluation capability
Code generation is only useful if the generated query retrieves relevant and trustworthy data. There are broadly two types of evaluation.
Benchmark (offline) evaluation is used during research and development. It compares the system's performance against a “gold standard.”
Production (online) evaluation is used in live applications, and the sophistication of this evaluation depends on the data scope and the opportunity for ground truthing. For data analysis, the evaluation must ensure two things:
Semantic correctness: Did the LLM correctly interpret the user’s intent?
Execution accuracy: Did the query run successfully, and are the results consistent with expected data patterns?
Data scope
The scope of data that an AI-system for data analysis has access to varies. In legacy BI tools like Power BI and Tableau, the online evaluation is relatively simple because the LLM operates within a controlled environment, such as a single dashboard. For example, the sales dashboard will only be connected to data sources related to sales. The limited data scope simplifies online evaluation because the scope of ambiguity is low. The evaluation is focused on how well the natural language query maps to metrics defined in the semantic layer and columns within the data tables.
AI-first data analysis systems have a broader data scope and must identify the most relevant data sources and tables. The context layer is critical for disambiguation because it contains historical queries, past user feedback, and data relationships.
Ground truth
In legacy BI tools, the dashboard serves as a known correct view of the data; it is already a human-verified output. More advanced platforms perform result validation by comparing against historical queries, historical trends, or known facts within the context layer.
For example, when querying depth data, the system will flag anomalous values that may be caused by unit differences (like feet vs. meters).
Interactive user interface
AI-first data analysis systems prioritize conversational interaction and self-service investigation over traditional static dashboards. Instead of the drag-and-drop dashboard found in traditional BI, a user explores data by asking questions.
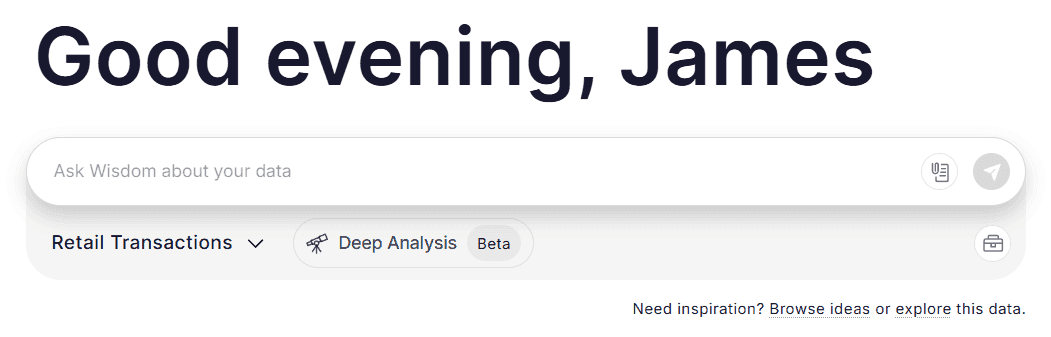
WisdomAI conversational data analysis user interface (source)
Multi-modal output
When responding to a question, the system provides a multi-modal output that includes the following:
A text-based summary
A visualization
Source data
Reasoning
The generated query
The multi-modal output enables AI-first systems to integrate both structured and unstructured data sources. For example, the results from structured sales data can be combined with unstructured customer reviews. To incorporate unstructured data into a traditional BI system would require an ETL workflow to transform the customer reviews into a structured schema, a process that often removes valuable context. For example, storing customer feedback scores in a structured schema is easy, but the underlying reason for the score may not be stored because it cannot be visualized in a dashboard.
AI-first systems like WisdomAI provide inspiration for users based on the selected data source, past user sessions, and the user’s role.
Deeper insights
AI-first systems provide capabilities for all types of data analysis. The conversational interface supports exploratory data analysis to answer questions like “what happened?”
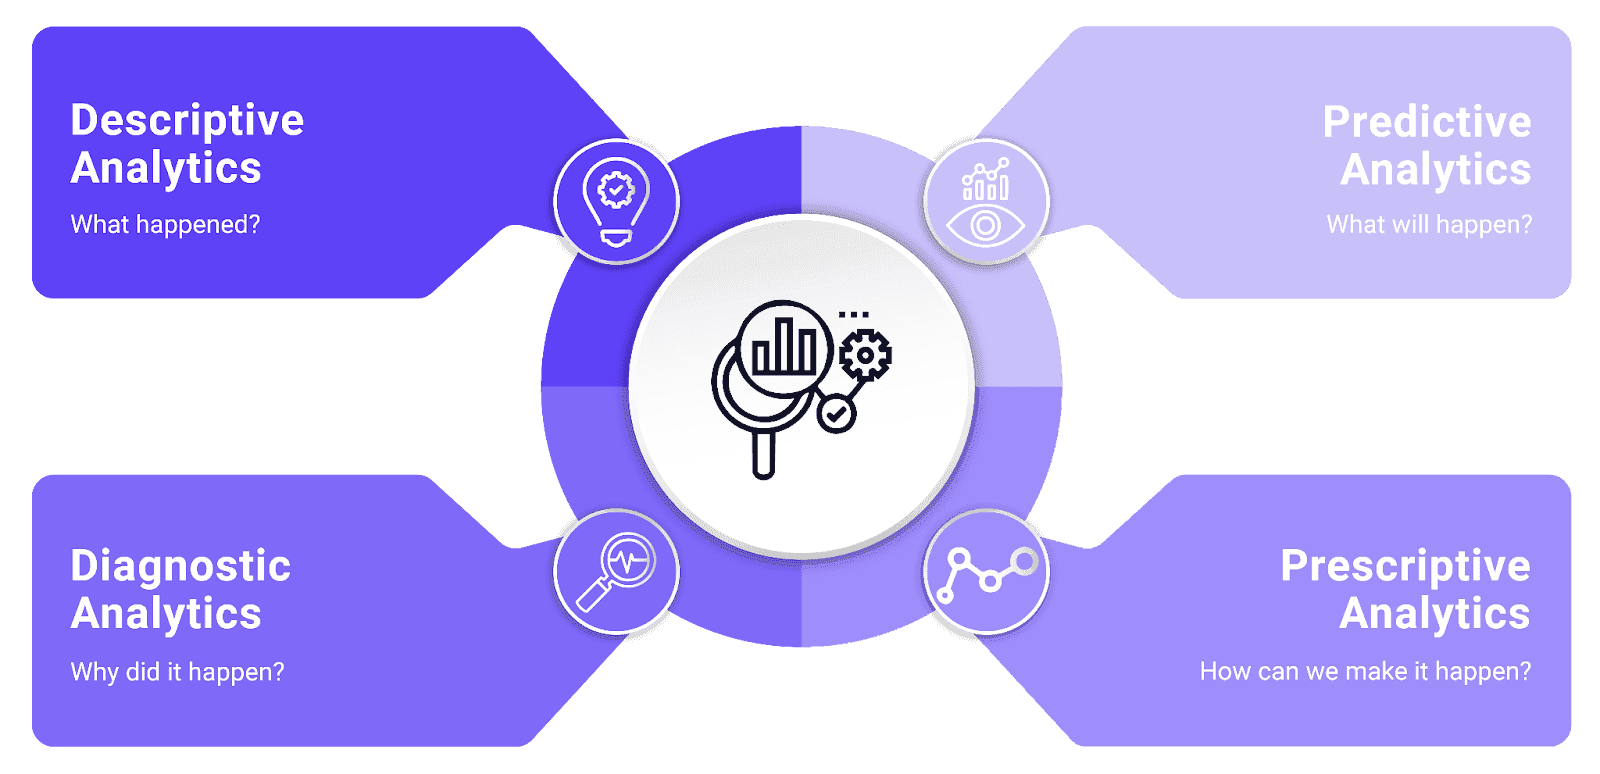
In legacy BI tools, deeper analysis is often performed outside of the tool because further context is required to answer:
Why did it happen?
What will happen?
How can we make it happen?
A conversational interface is a natural way to perform these different types of analytics.
Proactive agents
Proactive agents function as virtual data analyst assistants to monitor key metrics, detect anomalies, and deliver insights. Proactive agents work as follows:
Setting a trigger: A user defines a threshold or event, e.g., “track my monthly revenue and alert me if it drops by 10%.”
The workflow is defined: The agent plans and executes the analytical process by fetching the required data, analyzing it, and applying the threshold.
Activating an alert mechanism: The agent sends an email or Slack message if the alert criterion is met.
Last thoughts
The analytics landscape is rapidly changing, with each platform offering unique advantages and trade-offs. Some are built for enterprise reporting and governance, while others focus on AI-driven automation and conversational analytics. Next-generation tools push the boundary by offering real-time, no-code features.
The reality is that there's no single solution that fits all. The best choice depends on your team's goals, the complexity of your data, and the level of automation you need. The simplest way to determine which platform works for you is to try them out. Many offer free trials or demos, making it easy to see which one best fits your workflow.
Analytics is evolving, with AI helping teams ask questions naturally and spot patterns in real time. Don't wait for the future to land on your desk; try these tools now and watch how they transform the way your team works with data.